
What are HR metrics?
HR metrics are measurements that determine the effectiveness of your human resources initiatives. Once you’ve determined your critical goals for recruiting; retention; and diversity, equity, inclusion, and belonging (DEI&B); you can use HR metrics to take a data-driven approach to track and assess your progress and challenges.
Key insights
- HR metrics are essential tools for tracking and improving recruitment, retention, and DEI&B initiatives
- Leveraging data-driven insights helps HR professionals make strategic decisions and drive business success
- Time-to-fill, quality-of-hire, and employee growth rate can enhance hiring strategies while metrics like pay gap analysis and gender diversity ratios build an inclusive workplace culture
Why should HR use a data-driven approach?
In today’s world of work, HR professionals are involved in strategic decisions about their company’s growth and success—what is working, what isn’t, and where to invest future efforts. But HR leaders don’t gather all their insights or make these decisions in a bubble. They work with other departments to devise a business strategy and identify goals to drive business transformation.
Close collaboration between HR and other key departments makes sense: In what Deloitte calls the emergence of “boundaryless HR” in its 2024 Global Human Capital Trends research, 81 percent of business executives surveyed said that their business and people agendas are more intertwined than ever before.
According to Deloitte, the most effective HR teams today “focus on shared outcomes, such as agility, customer satisfaction, and human performance, and analytics that combine multiple data sources (HR, finance, operations, etc.) to uncover issues and illuminate solutions.”
Turning insights into action begins with people data: the facts and figures that support key conversations that enable HR to gain a deep understanding of their organizations. This data is also fundamental to identifying problem areas early before they cost the company money or talent. But accessing and interpreting that data isn’t always easy.
Even when companies have data, that information can be siloed by departments or technology systems. As a result, leaders don’t see the whole picture.
Sometimes, companies have so much data available that leaders need help digesting all the information to make good decisions. Companies are increasingly hiring HR data analysts to help sift through the information and provide insights. They are also turning to HR technology, such as an HCM, to help gather and parse data.
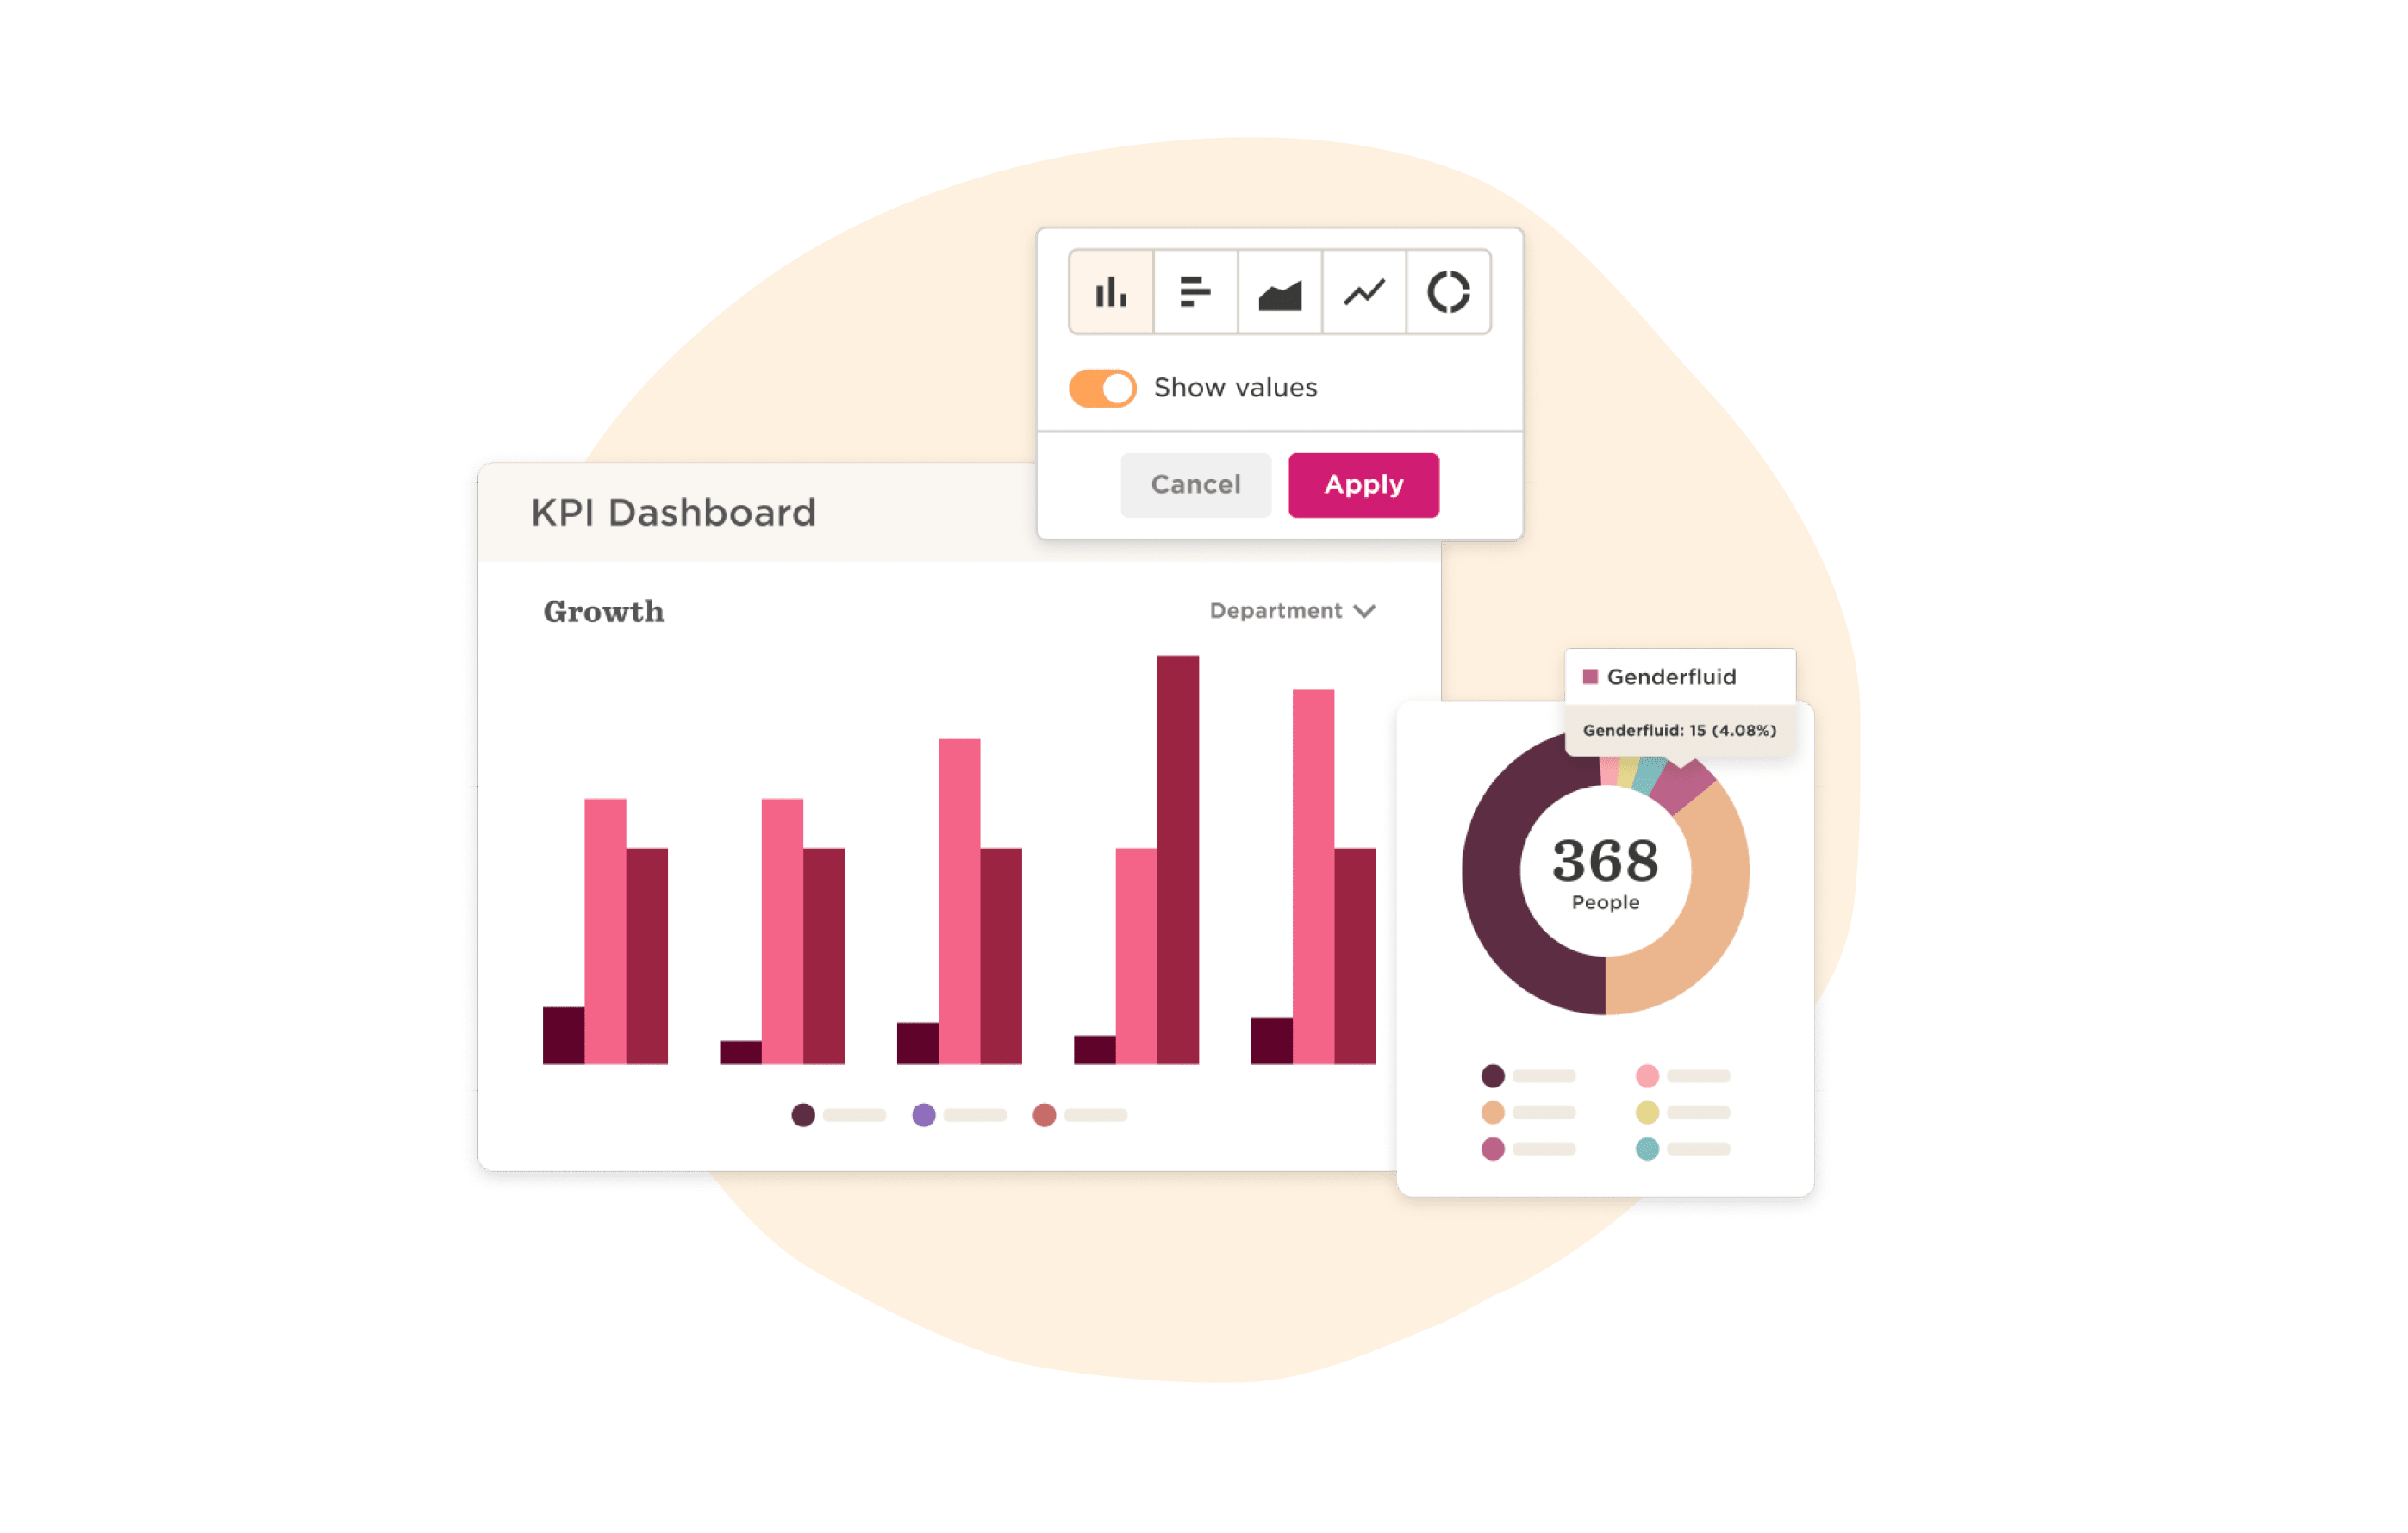
If your organization doesn’t have HR data analysts or sophisticated HR technology, you can still use key performance indicators (KPIs) to assess your business and make the informed, data-driven decisions you need to ensure business success.
In this guide, we’ll focus on three key areas that help to define a company’s success:
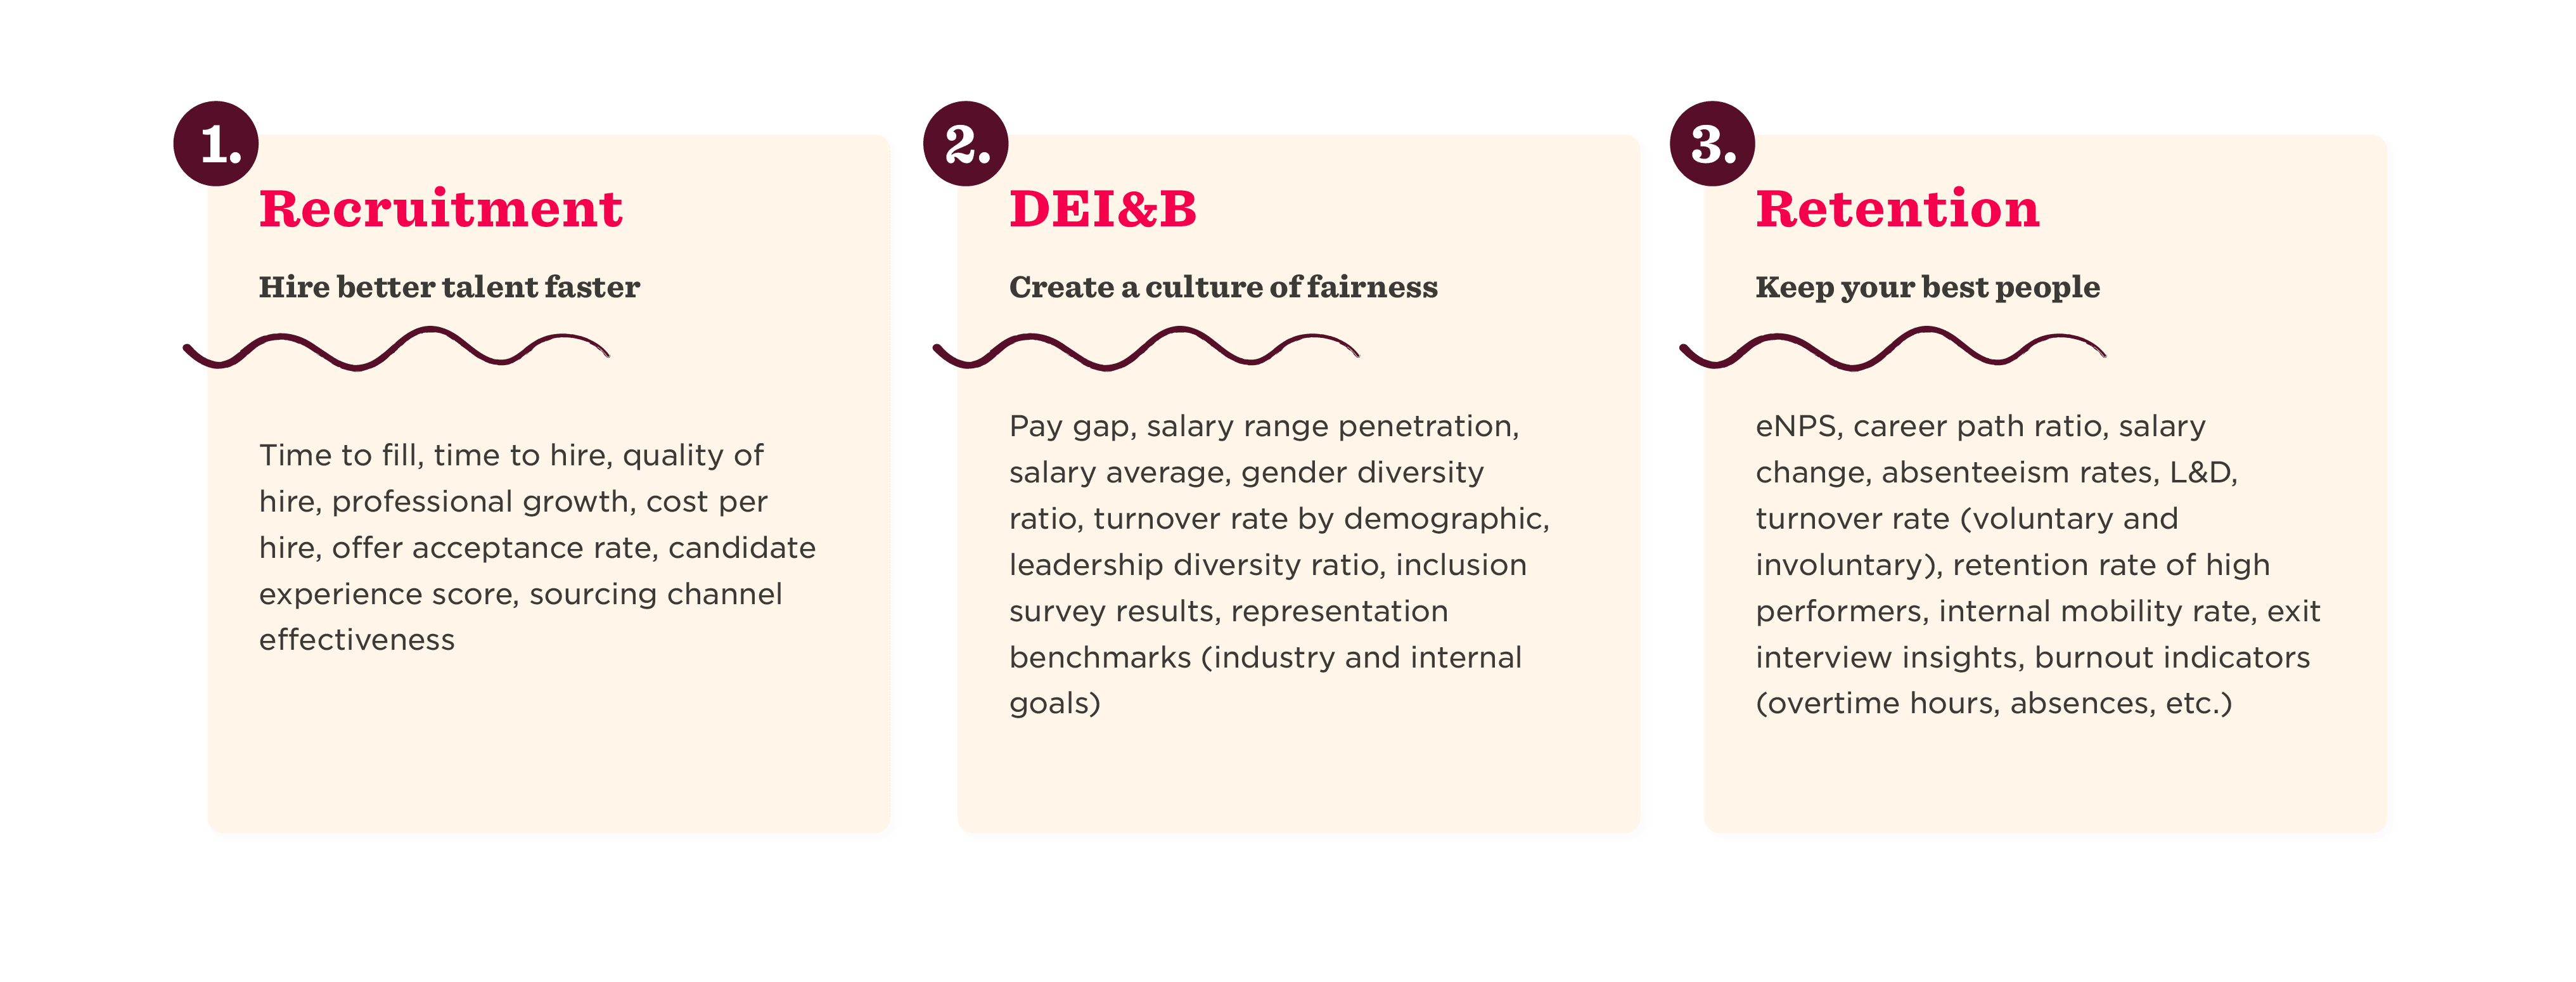
Recruitment
Building a great recruitment strategy is vital to shaping a company’s future and helping HR develop strong workflows that enable hiring better talent faster.
Creating a smooth recruitment process also makes it easier for HR teams to collaborate with colleagues across the organization, including hiring managers and partners in finance and legal.
By working together, HR leaders can craft a recruitment strategy that attracts top talent, aligns with organizational goals, reduces bottlenecks, and enhances the candidate experience. Most importantly, effective recruitment strategies help businesses remain competitive in today’s dynamic job market.

Key metrics to help measure recruitment
To optimize recruitment, it’s essential to track the right metrics. Keeping track of these data points is key to painting a clear picture of how your hiring process performs, highlights what can be improved, and helps refine strategies for long-term success. Here are some of the most critical metrics for measuring the effectiveness of your recruitment strategy and how to calculate them.
1. Time-to-fill and time-to-hire
Time-to-fill and time-to-hire are two of the most important recruitment metrics—but they’re not the same. The difference is small but meaningful, especially since recruiting costs are so high. And the more time you spend on interviews, the more expensive the process becomes.
Diving into these two metrics can help HR find lags in both the recruitment processes (such as posting jobs on the wrong channels or too few recruiters dealing with too many applicants or open roles) and interview processes (hiring managers who are slow to respond, overly complicated tasks, or involving too many people in the decision).
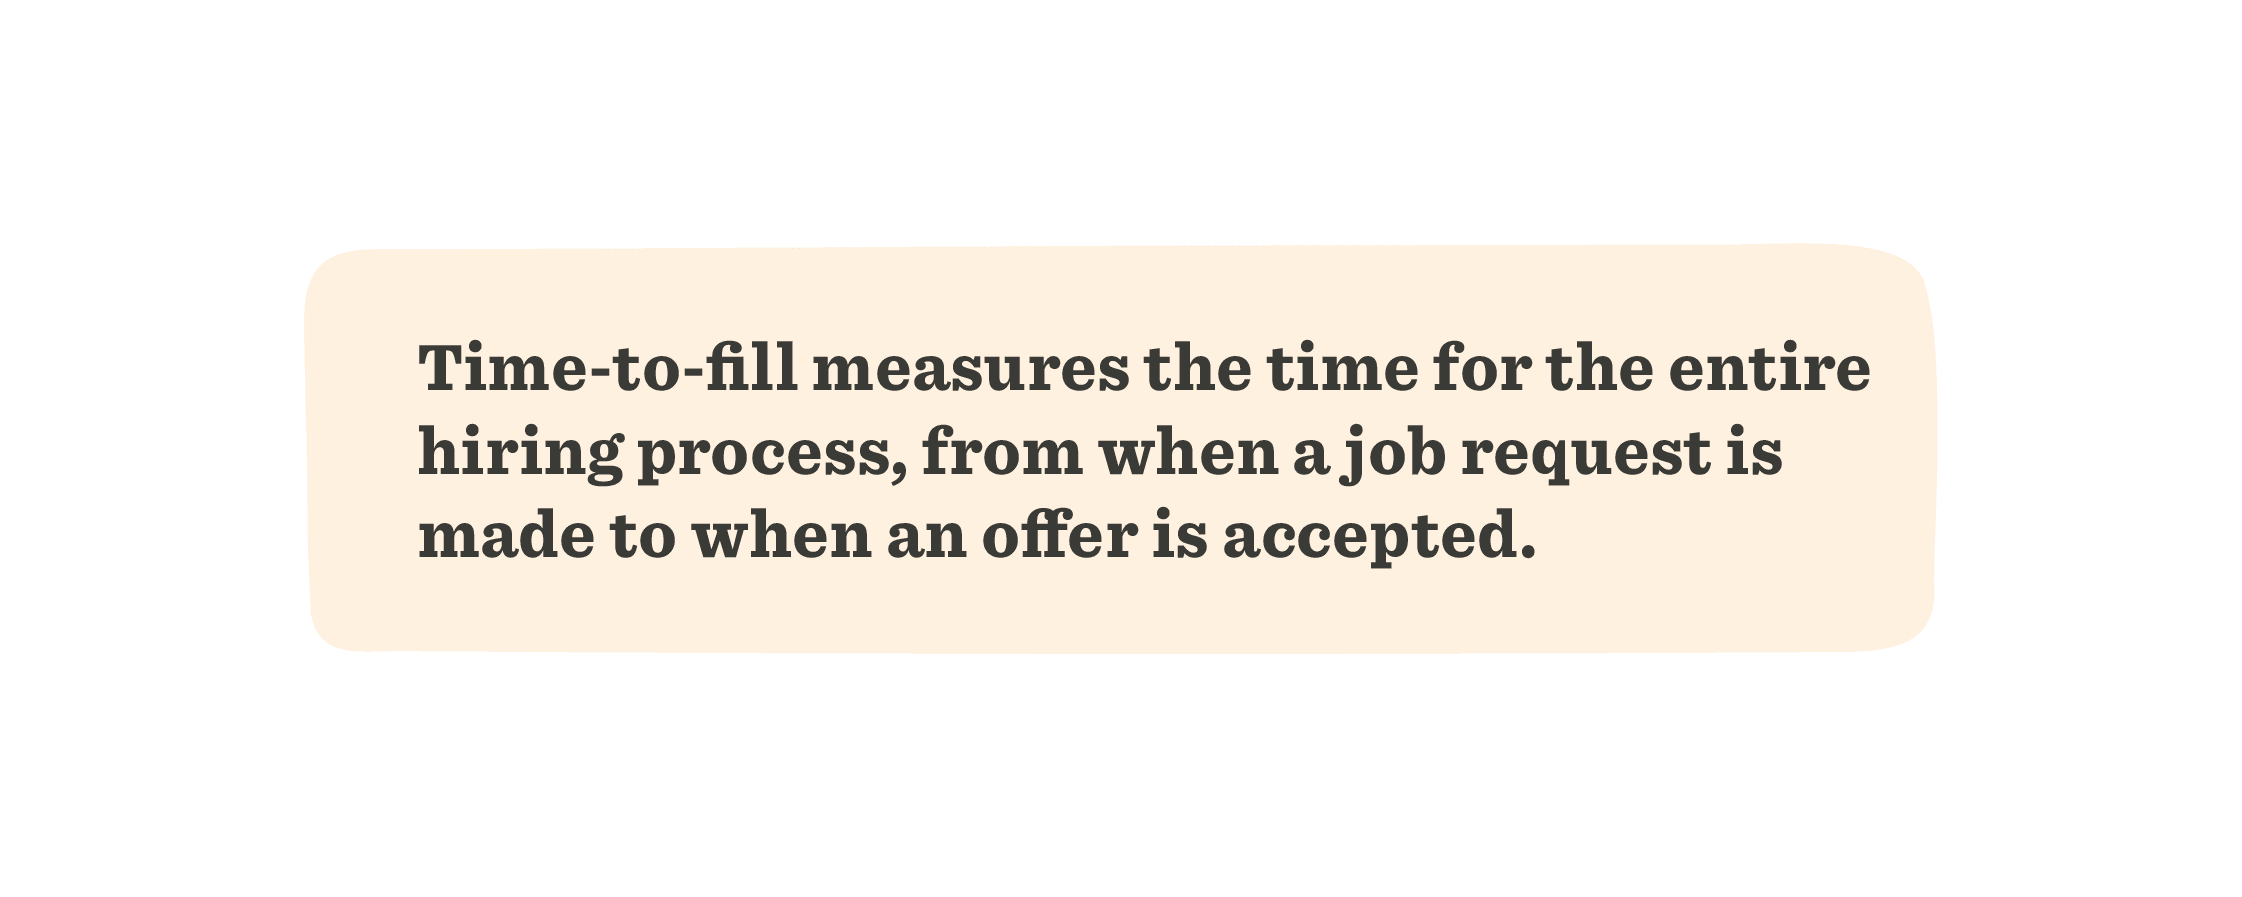
Time-to-fill can be measured company-wide or by department or role.
Your formula to calculate time-to-fill is: The number of days between the starting point (when the role is approved or advertised) and the endpoint (the date the candidate accepts the job).
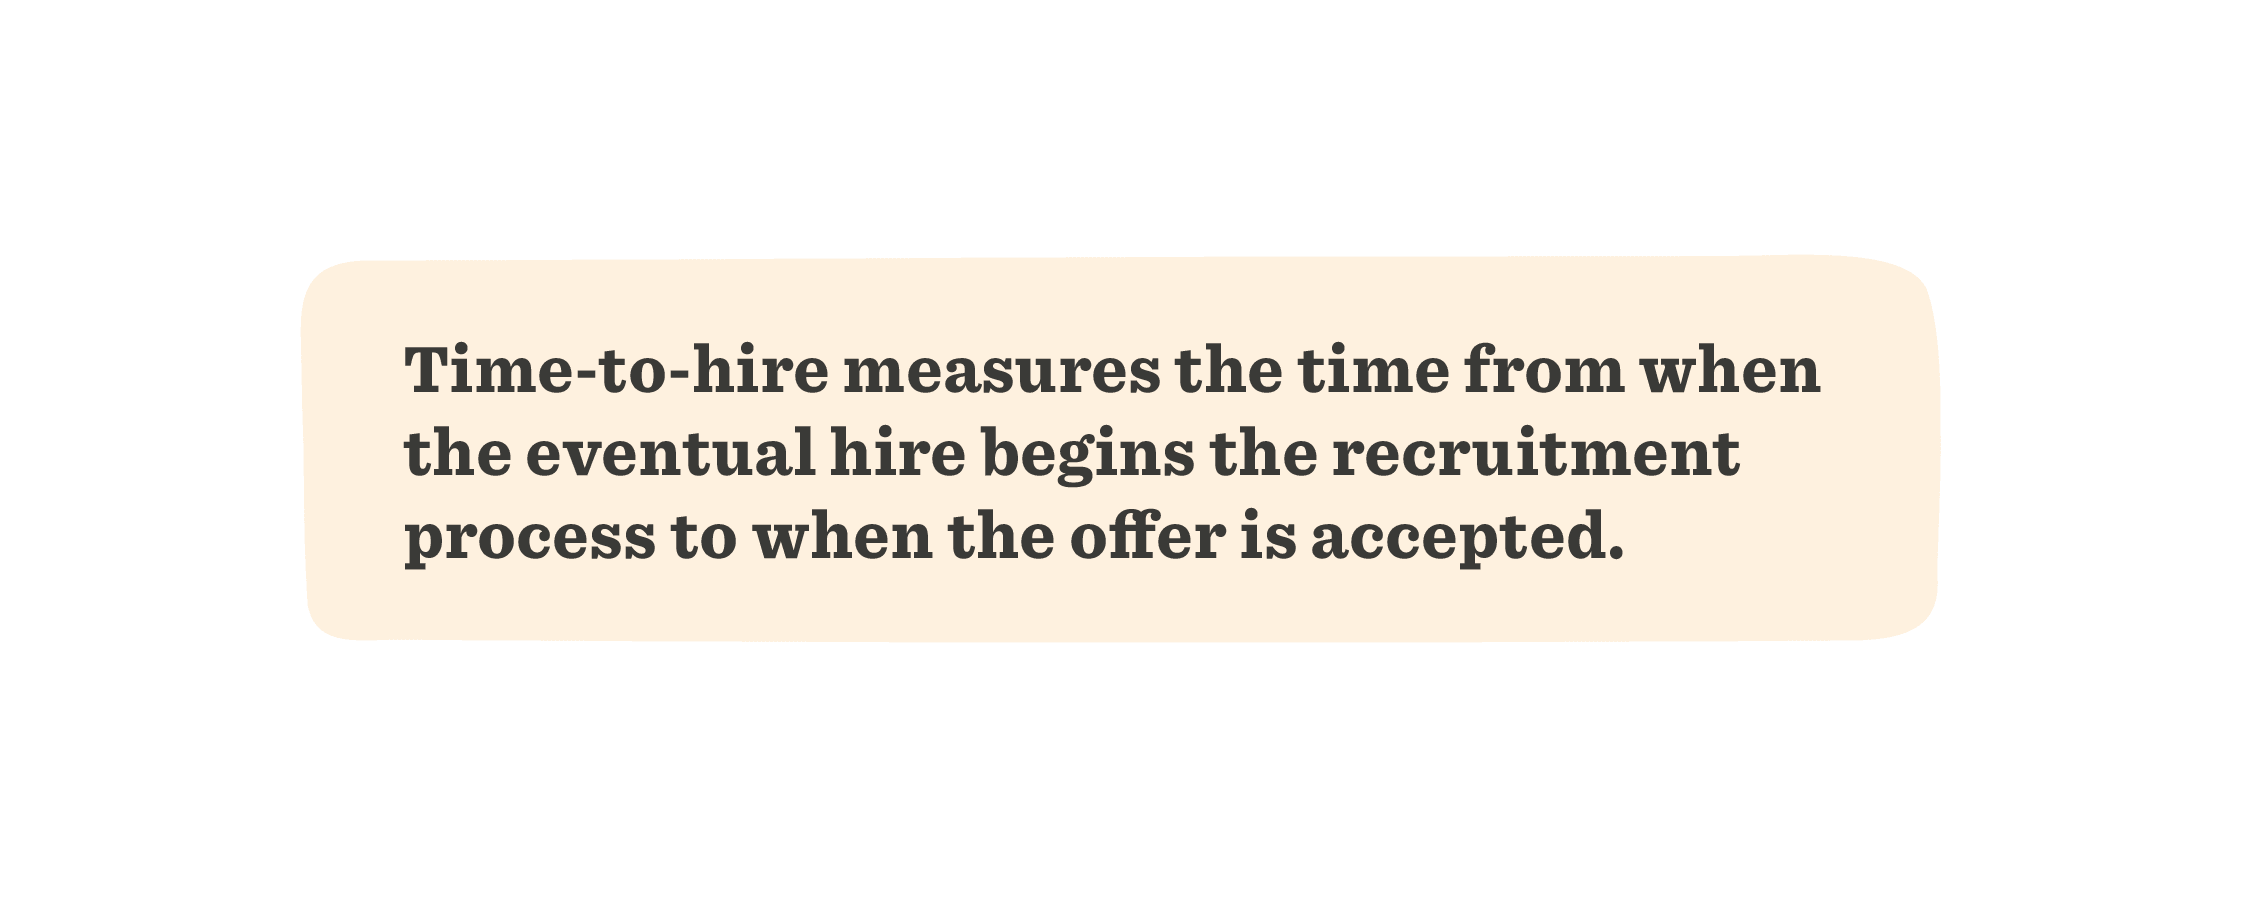
The average time-to-hire is currently 44 days.
Your formula to calculate time-to-hire is: The number of days between the starting point (when the new hire starts the recruitment process) and the endpoint (the date the candidate accepts the job).
2. Quality-of-hire
Quality-of-hire, which gauges the value a new hire adds to an organization, is considered the “holy grail” of HR metrics. In a LinkedIn study, 88 percent of recruiting professionals said this data would be helpful. However, less than half (48 percent) said they currently use it.
A healthy quality-of-hire score shows that recruiters bring in good people, managers support retention efforts, and new hires thrive in their new roles. You can measure the score by taking a few key HR metrics into consideration, based on your company’s goals and priorities.
First, determine which metrics you want to focus on, assign a number from 1-5 to measure an employee’s effectiveness in regards to the metric, and then calculate as follows:
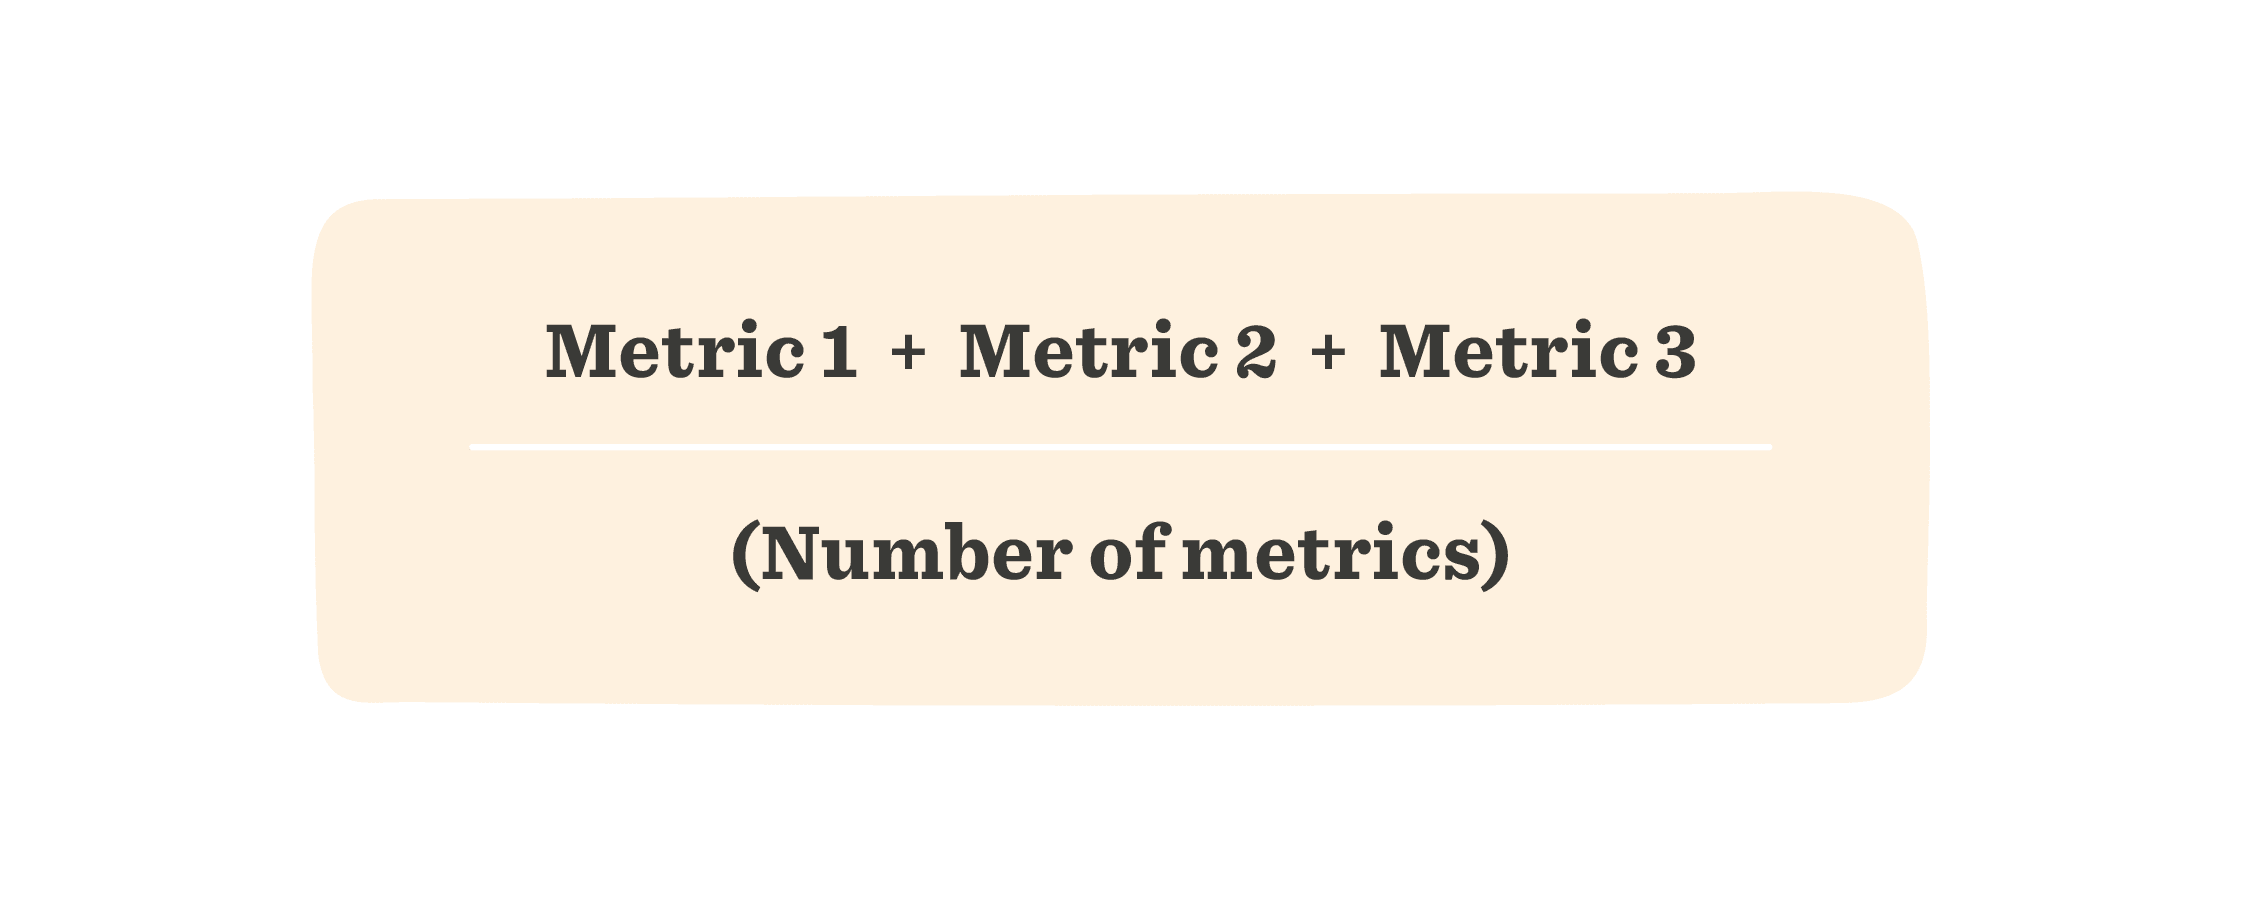
The LinkedIn study found that the top three metrics for quality-of-hire are employee retention, employee engagement, and performance appraisal score. The list of measurable metrics is long and varied.
Quality-of-hire can be measured continuously throughout a person’s time at the company—and even before.
Pre-hire quality is a predictive measure based on interviewer impressions, referrals, scores on aptitude tests, and performance on assignments/assessments. An accurate pre-hire quality measurement can help predict a candidate’s future success at a company, and some research shows that “organizations that invest in a strong candidate experience improve their quality of hires by 70%.”
Quality of hire can be measured at the end of the 90-day onboarding period by looking at a new hire’s success in their role, social acclimation, and day-to-day performance. Manager reviews and 360-degree feedback can also help measure quality-of-hire at this early stage.
Recommended For Further Reading
- 9 workforce management metrics that drive success
- The payroll metrics that matter most
- Top employee performance metrics to track
- Driving diversity: How to evaluate key DEI&B metrics
- Hire effectively: essential recruiting metrics to track
- 31 workforce planning metrics to track
- 10 trackable succession planning metrics for any organization
- How to integrate HR data for better decision-making
- 21 Leading HR reporting software
- HR effectiveness: What it is and how to measure it
3. Employee growth rate
A healthy company positioned to succeed is growing and adding new team members. Company growth rate measures how much a company has grown or contracted over a specific period. A positive number shows a positive growth rate, i.e., that the company is growing. A negative number reveals a negative growth rate and that the number of people leaving is higher than the number joining the company.
Measuring the employee growth rate can help HR understand growth patterns in an organization and better plan for the future. The more a company grows, the more complex its needs will be.
To calculate your company’s growth rate, compare the number of employees at two different points in time and divide that number by the number of employees at the second time interval. The growth rate is usually expressed as a percentage.
The formula for calculating the growth rate is:
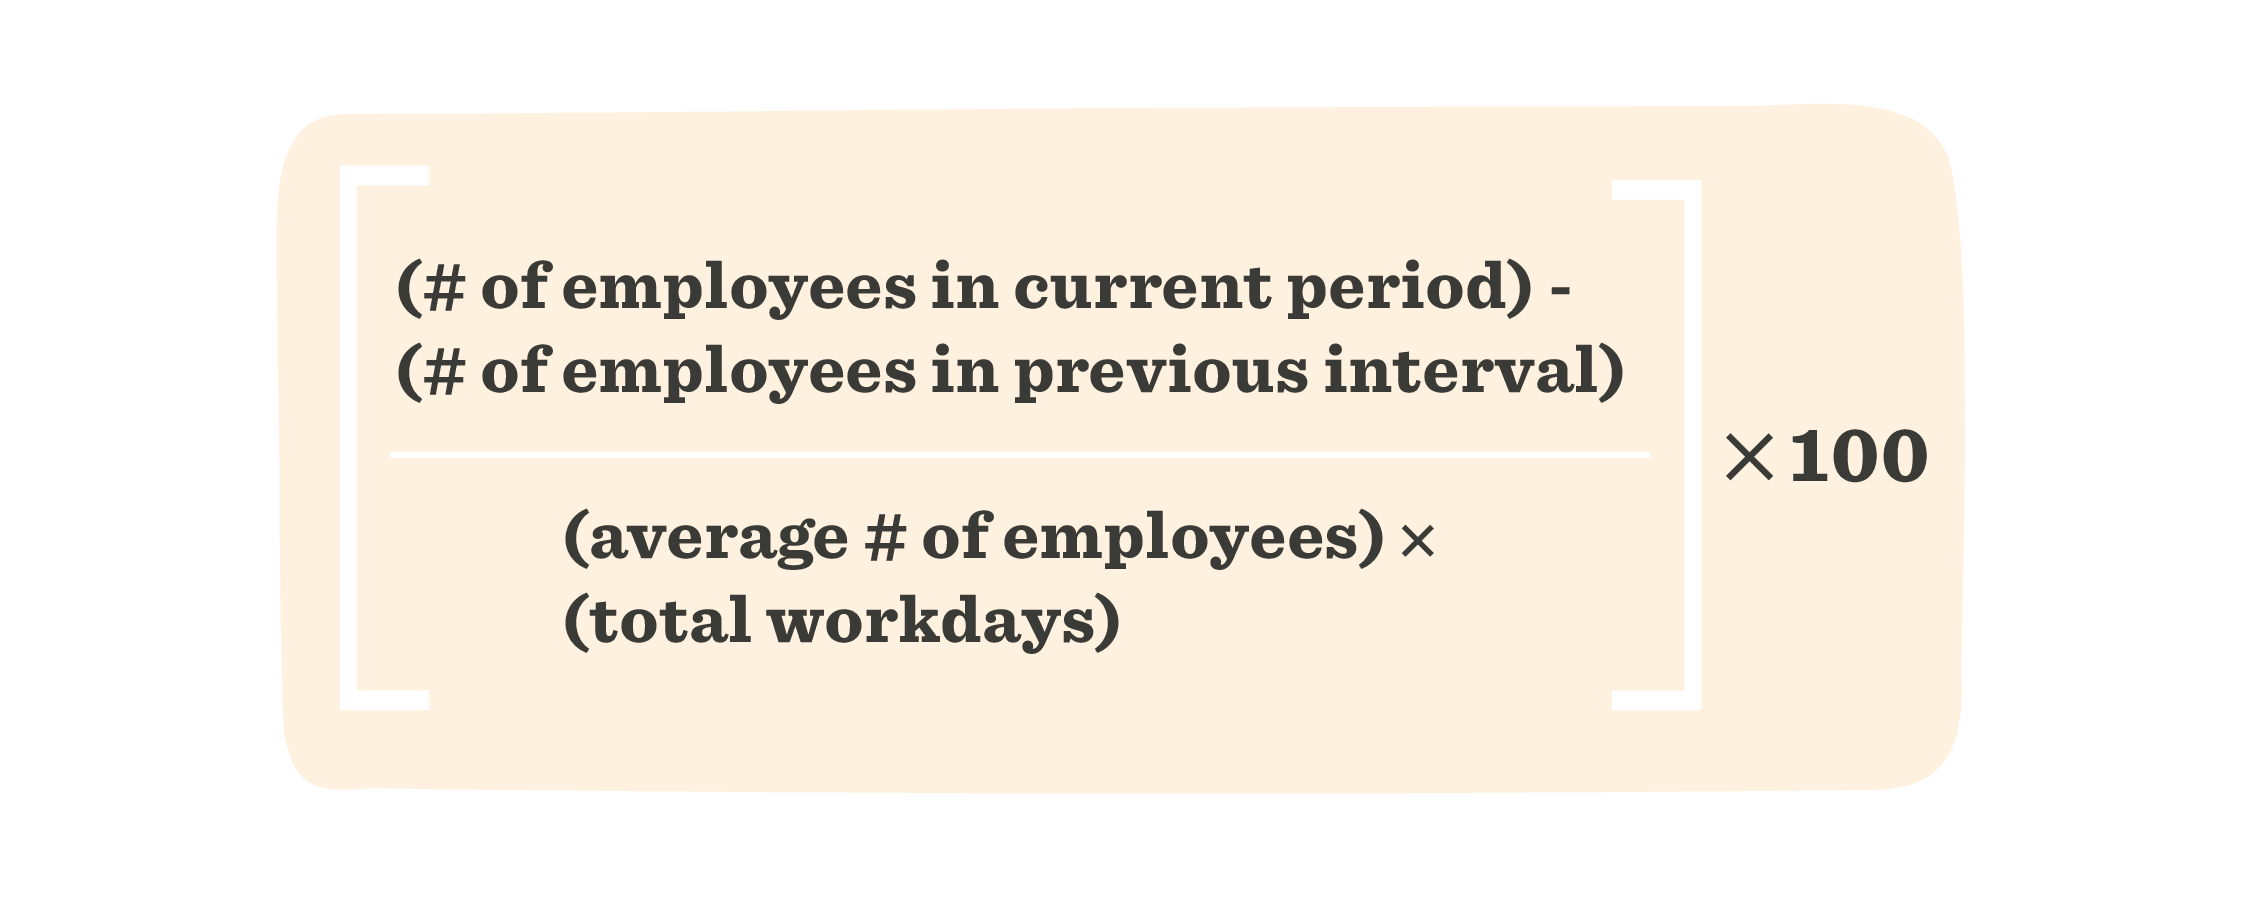
You can also calculate employee growth rates among a specific group in your organization, such as per team or department.
Other HR KPIs associated with company growth include headcount, which refers to the number of employees in your company, the number of new hires over a specified timeframe, and the number of terminated employees over a specified timeframe.
Diversity, equity, inclusion, and belonging (DEI&B)
It’s no secret that diverse teams work better. They’re a must-have—but they don’t build themselves. HR professionals are familiar with the term DE&I for diversity, equity, and inclusion. But the “b” for belonging is there because it takes more than diversity, equity, and inclusion for people to do their best work. They must feel they are an integral part of the organization, where they are seen, heard, and valued.
Here are metrics to objectively measure a company’s diversity efforts and successes and locate areas of improvement.

1. Pay gap
No single compensation leader or HR professional can solve the gender pay gap, which is a global issue. But, HR does have the power to shift the conversation and make closing the pay gap a priority.
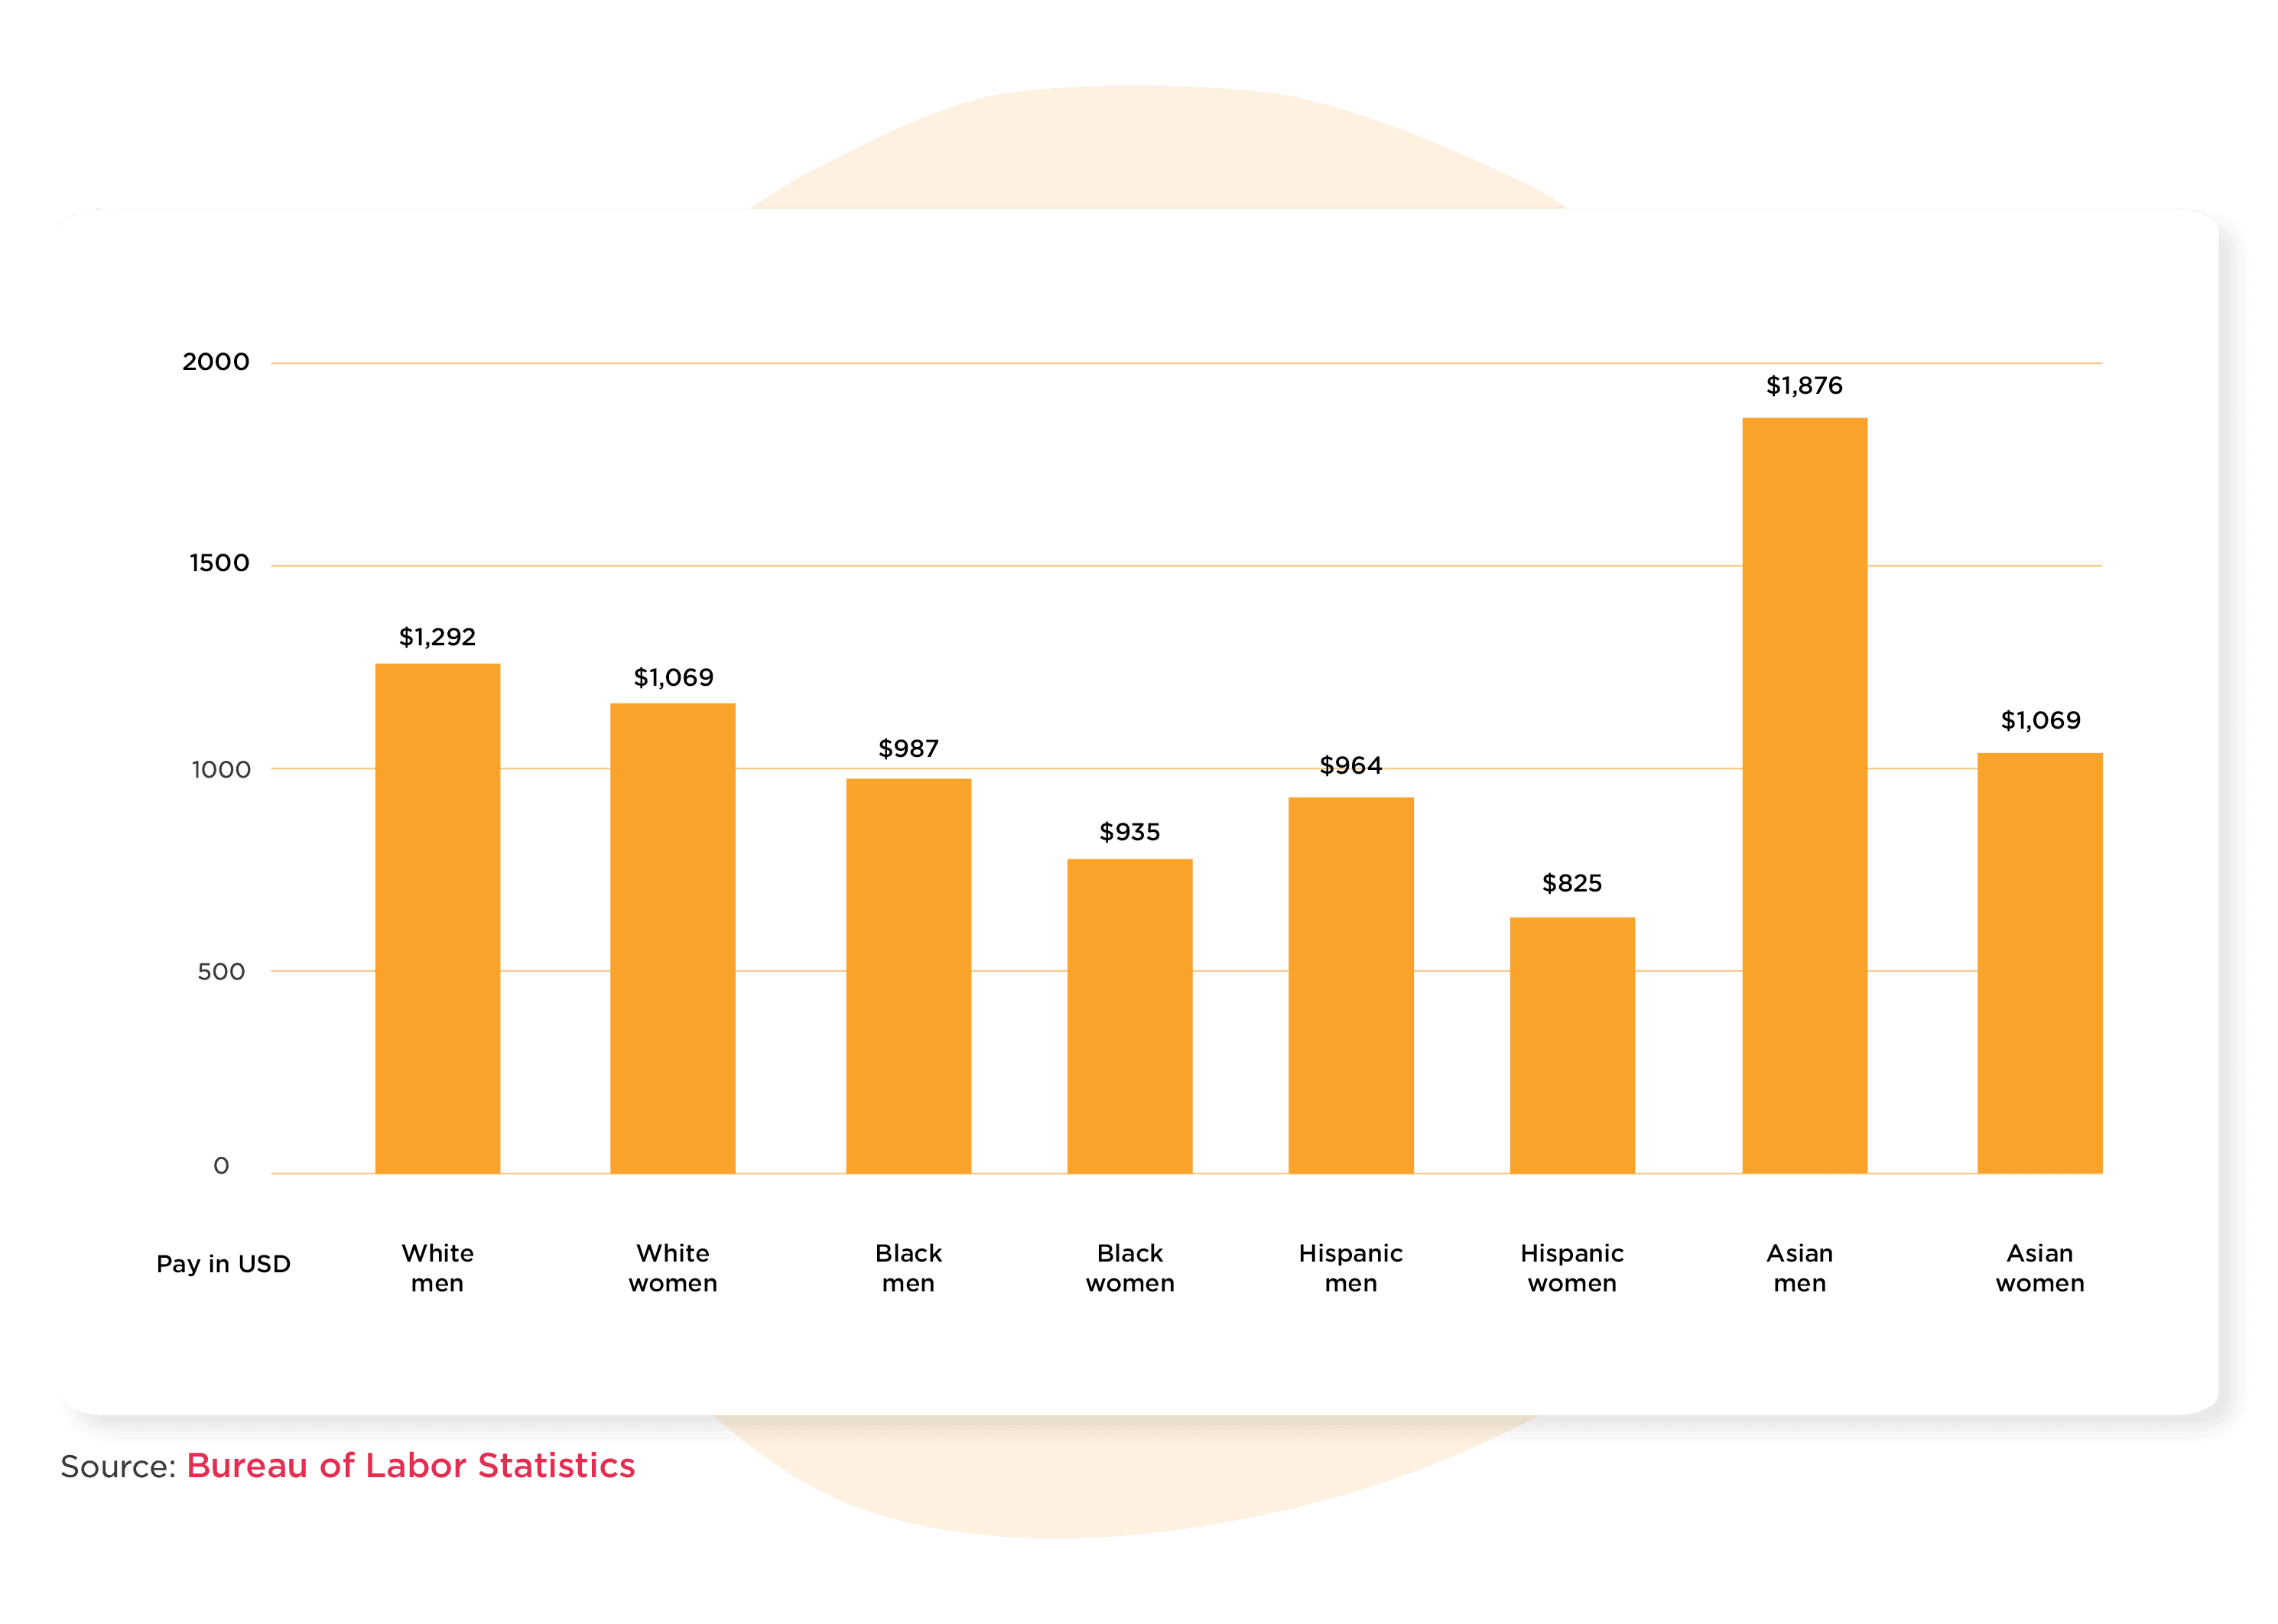
According to the Pew Research Center, the gender pay gap in the United States “hasn’t changed much in two decades” and currently stands at 18 percent—meaning women earn about 82 cents for every dollar. But, the pay gap also varies by race and ethnicity.
According to the Bureau of Labor Statistics, full-time Hispanic employees earn 76 percent less than White employees, for example. Black women earn 87.5 percent as much as White women and Asian men, and women’s earnings were higher than their White counterparts.
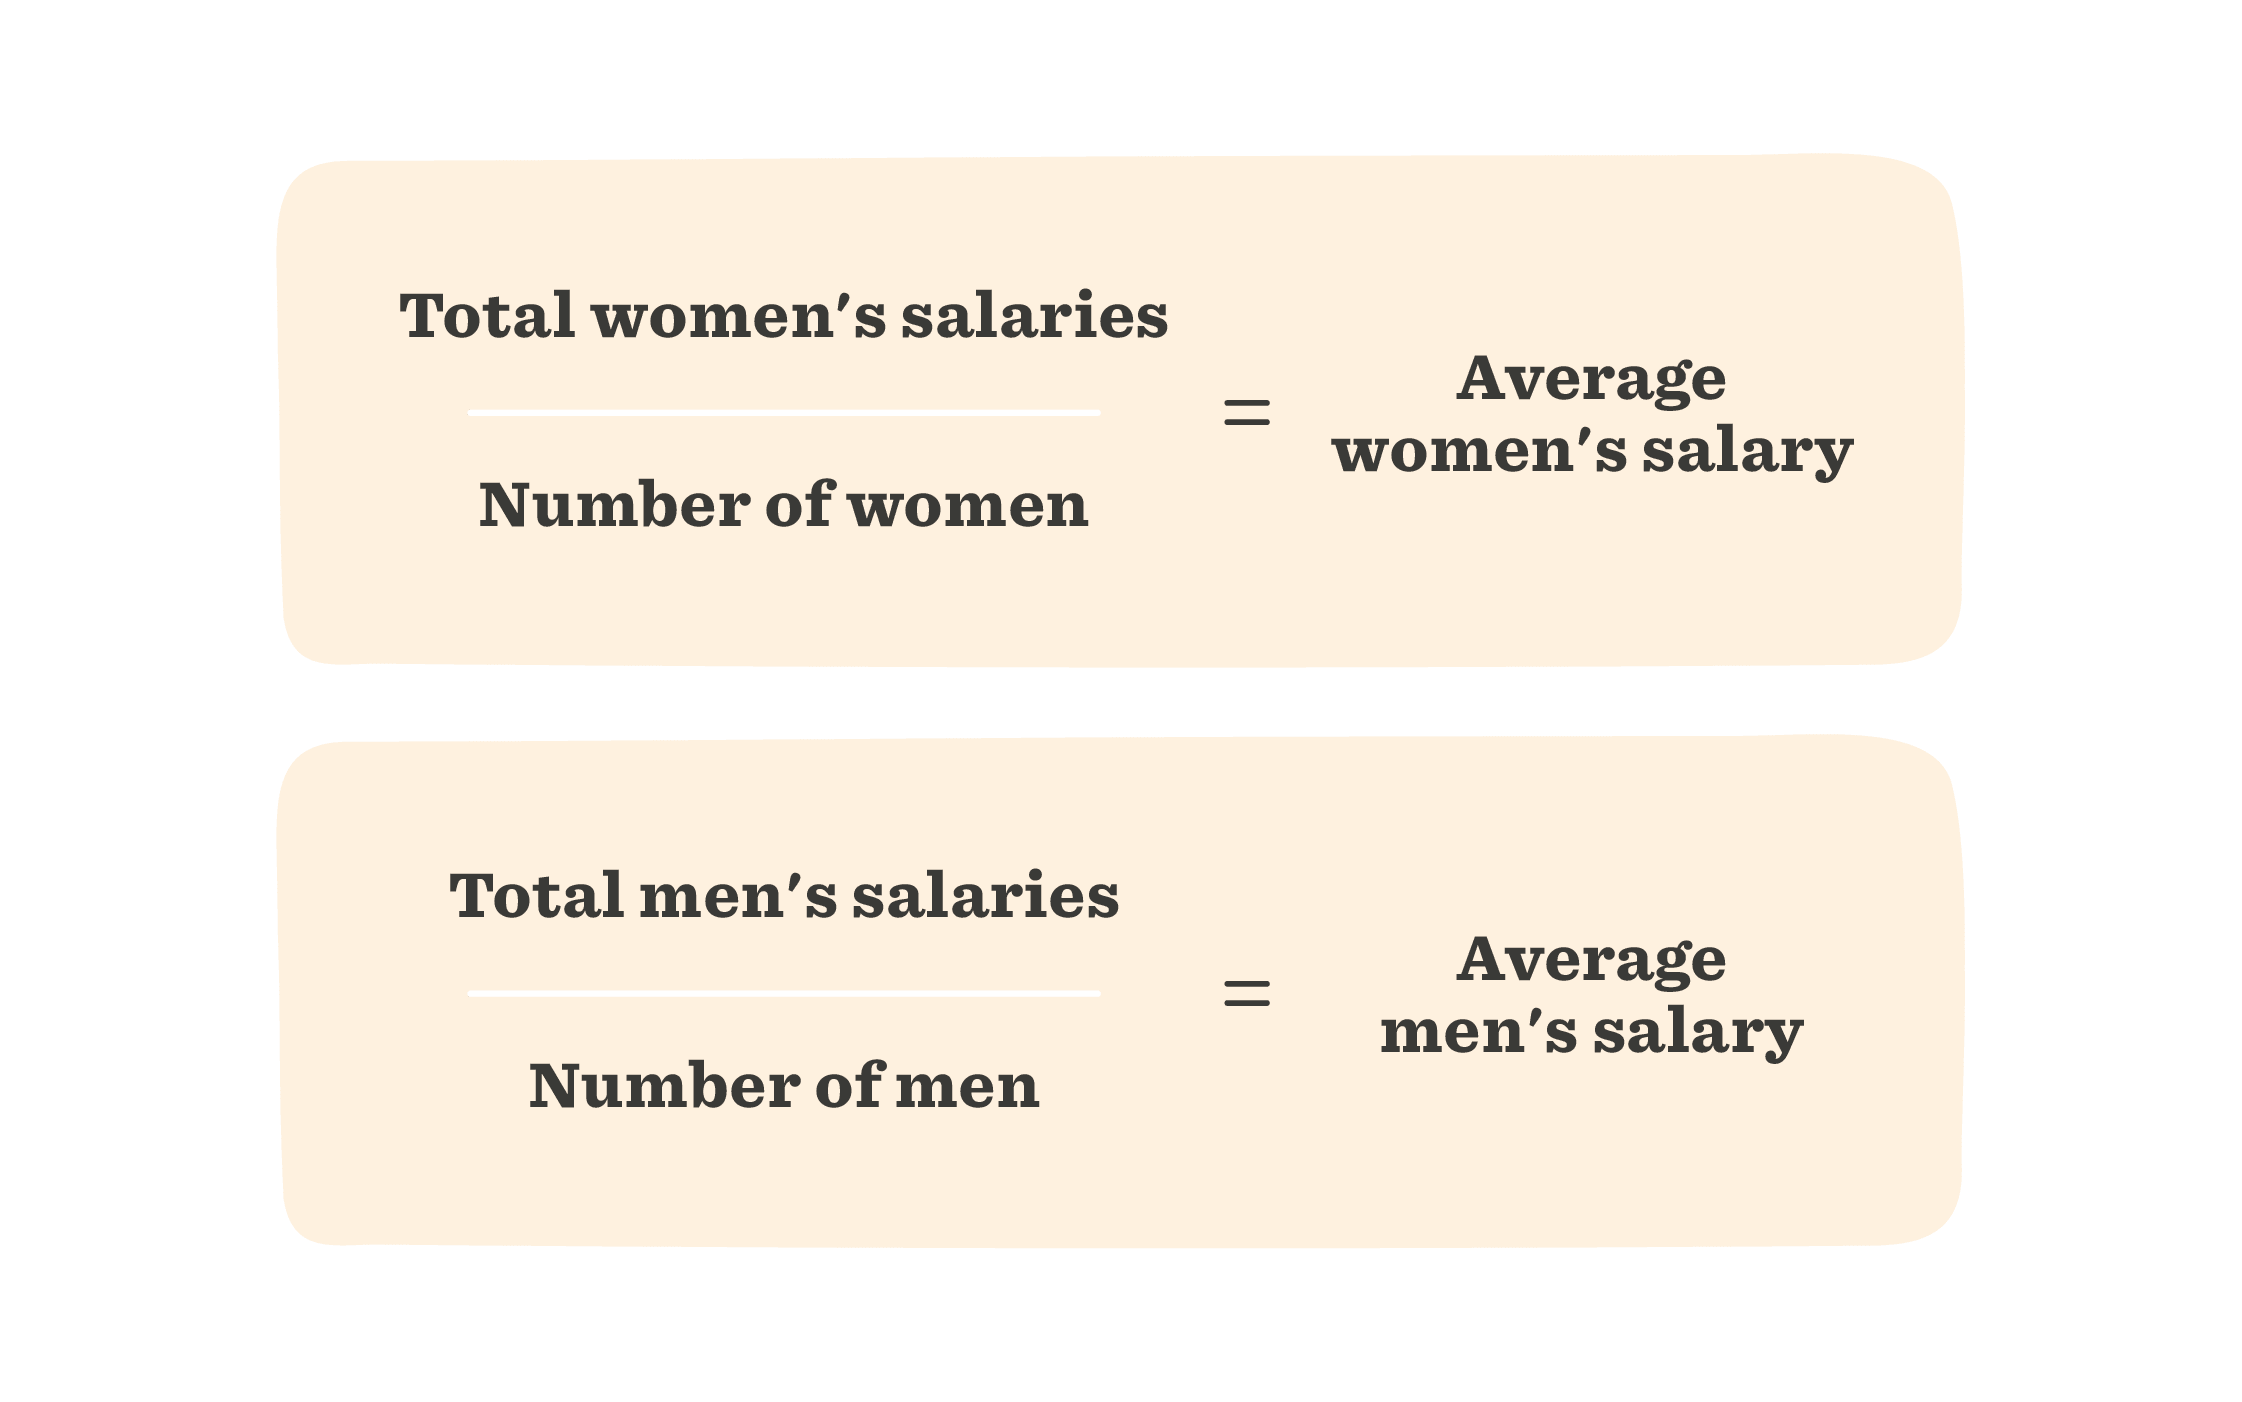
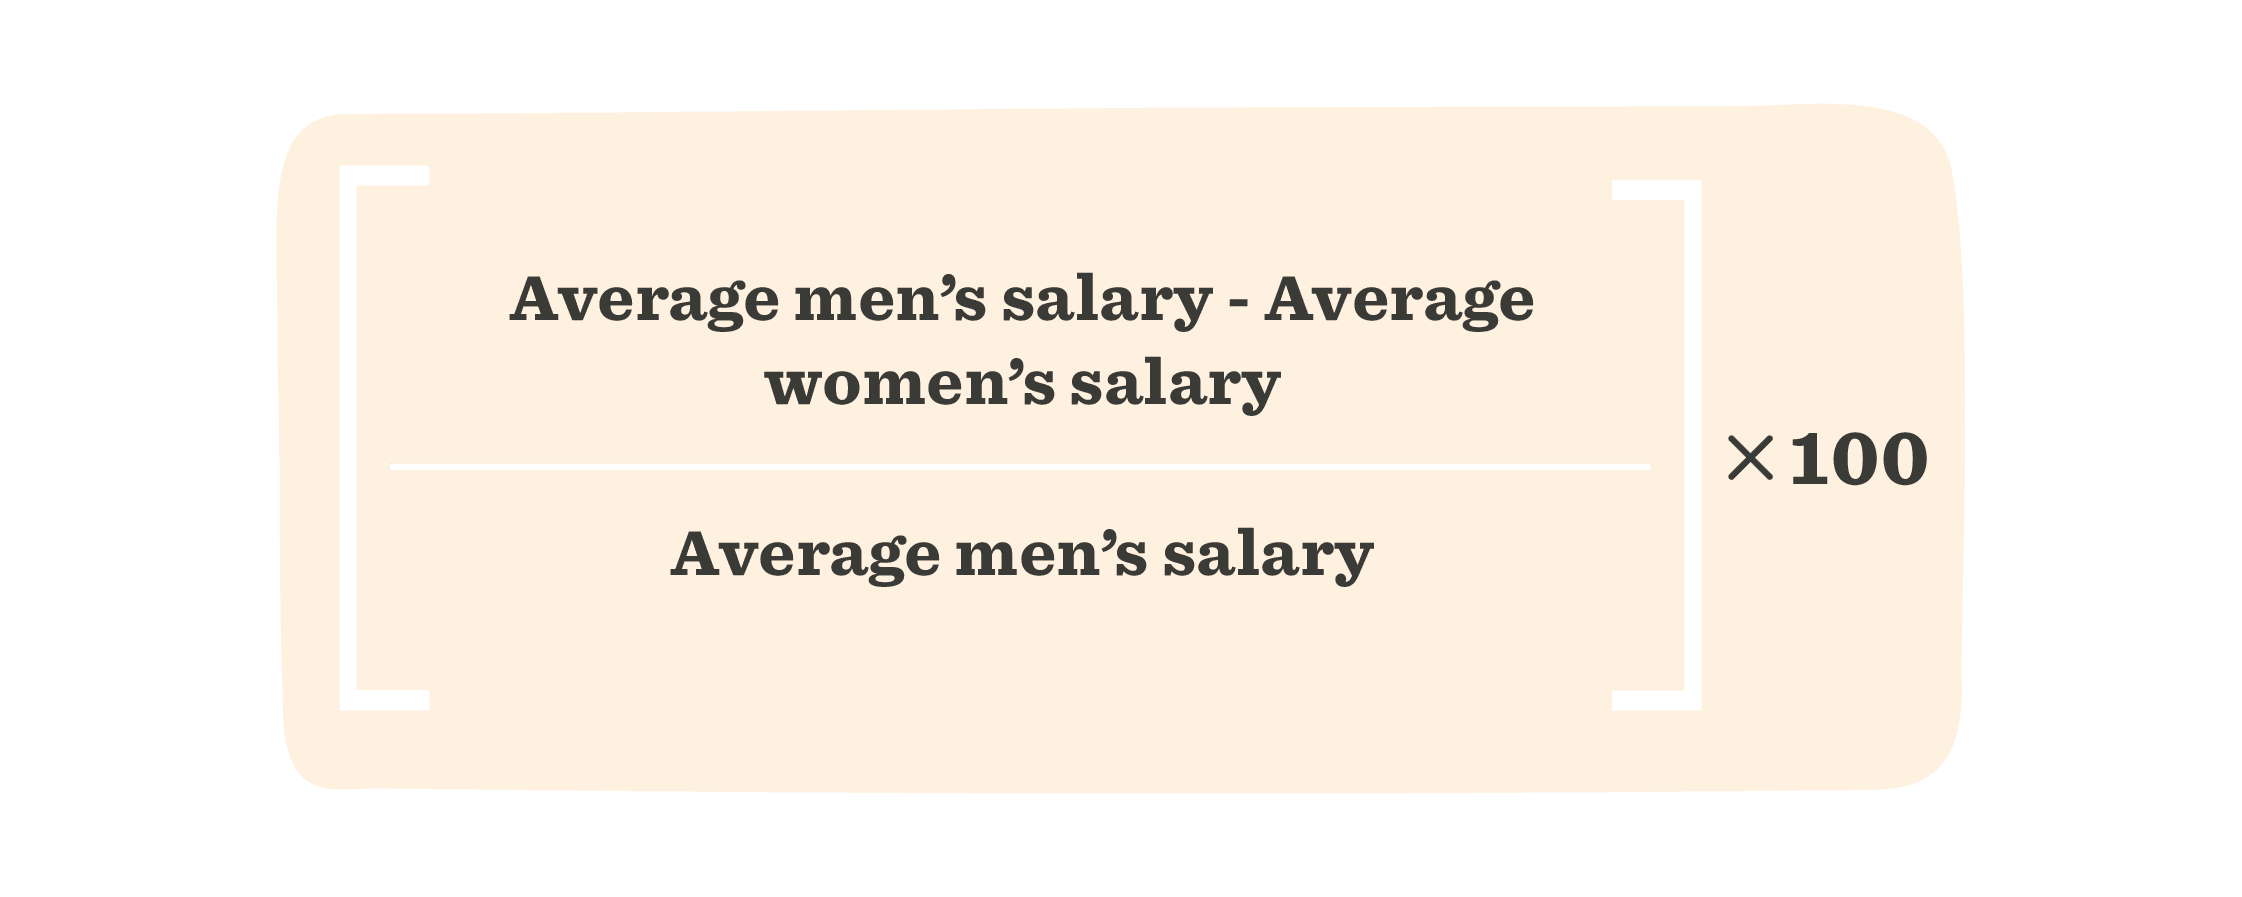
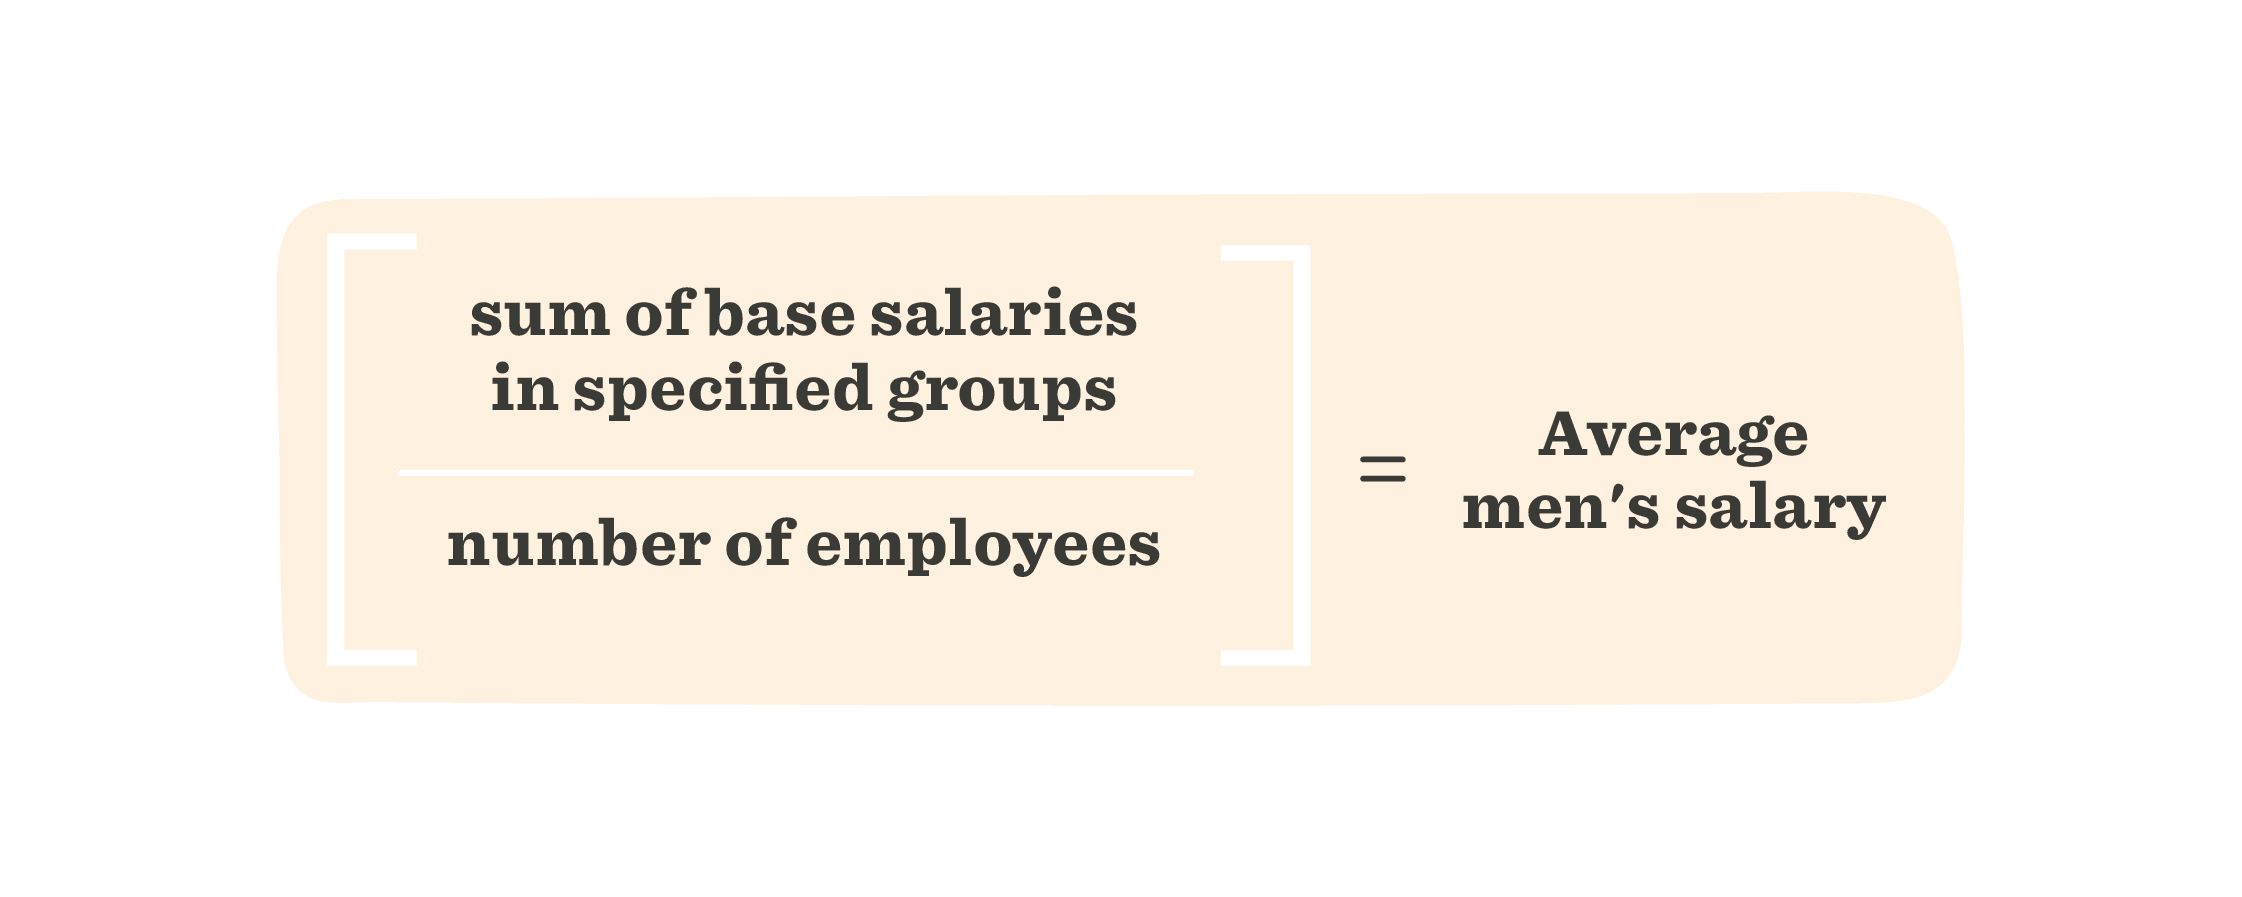
To calculate the pay gap, compare the salary averages of two different groups. For example, to measure the pay gap between men and women, find the salary averages for each gender. Next, subtract the women’s salary average from the men’s salary average.
Take this number, divide it by the men’s average, and multiply it by 100 to get the percentage difference between the two groups. Salary medians can similarly measure the pay gap (median compares the midpoint salary of each group).
Step 1:
Step 2:
These gaps represented by percentage can help HR professionals understand implicit and explicit differences in how their organization’s culture and policies apply to different gender, racial, and ethnic groups.
As you look at the gender pay gap, also take a close look at intersectionality—when people may have multiple identities that put them at a disadvantage in society.

For example, Black and Hispanic women face a gender pay gap because they earn less than men and a racial pay gap, because they earn less than white women. Other social identities, such as disability, ethnicity, class, weight, and physical appearance may combine with gender and result in additional disadvantages in salary.
The implications of the pay gap are immediate (current salary), cumulative (total lifelong losses), and benefits-related (non-monetary differences). With this data in hand, HR can work to build a system that addresses existing inequities and prevents future missteps.
2. Salary range penetration
Every job description in an organization should come with an estimated salary range. While there may be occasional deviations from this range for exceptional candidates, the range should reflect the standard pay for this position. Using this assigned range, HR can calculate someone’s salary range penetration—meaning, how far they are into their range.
The formula is:
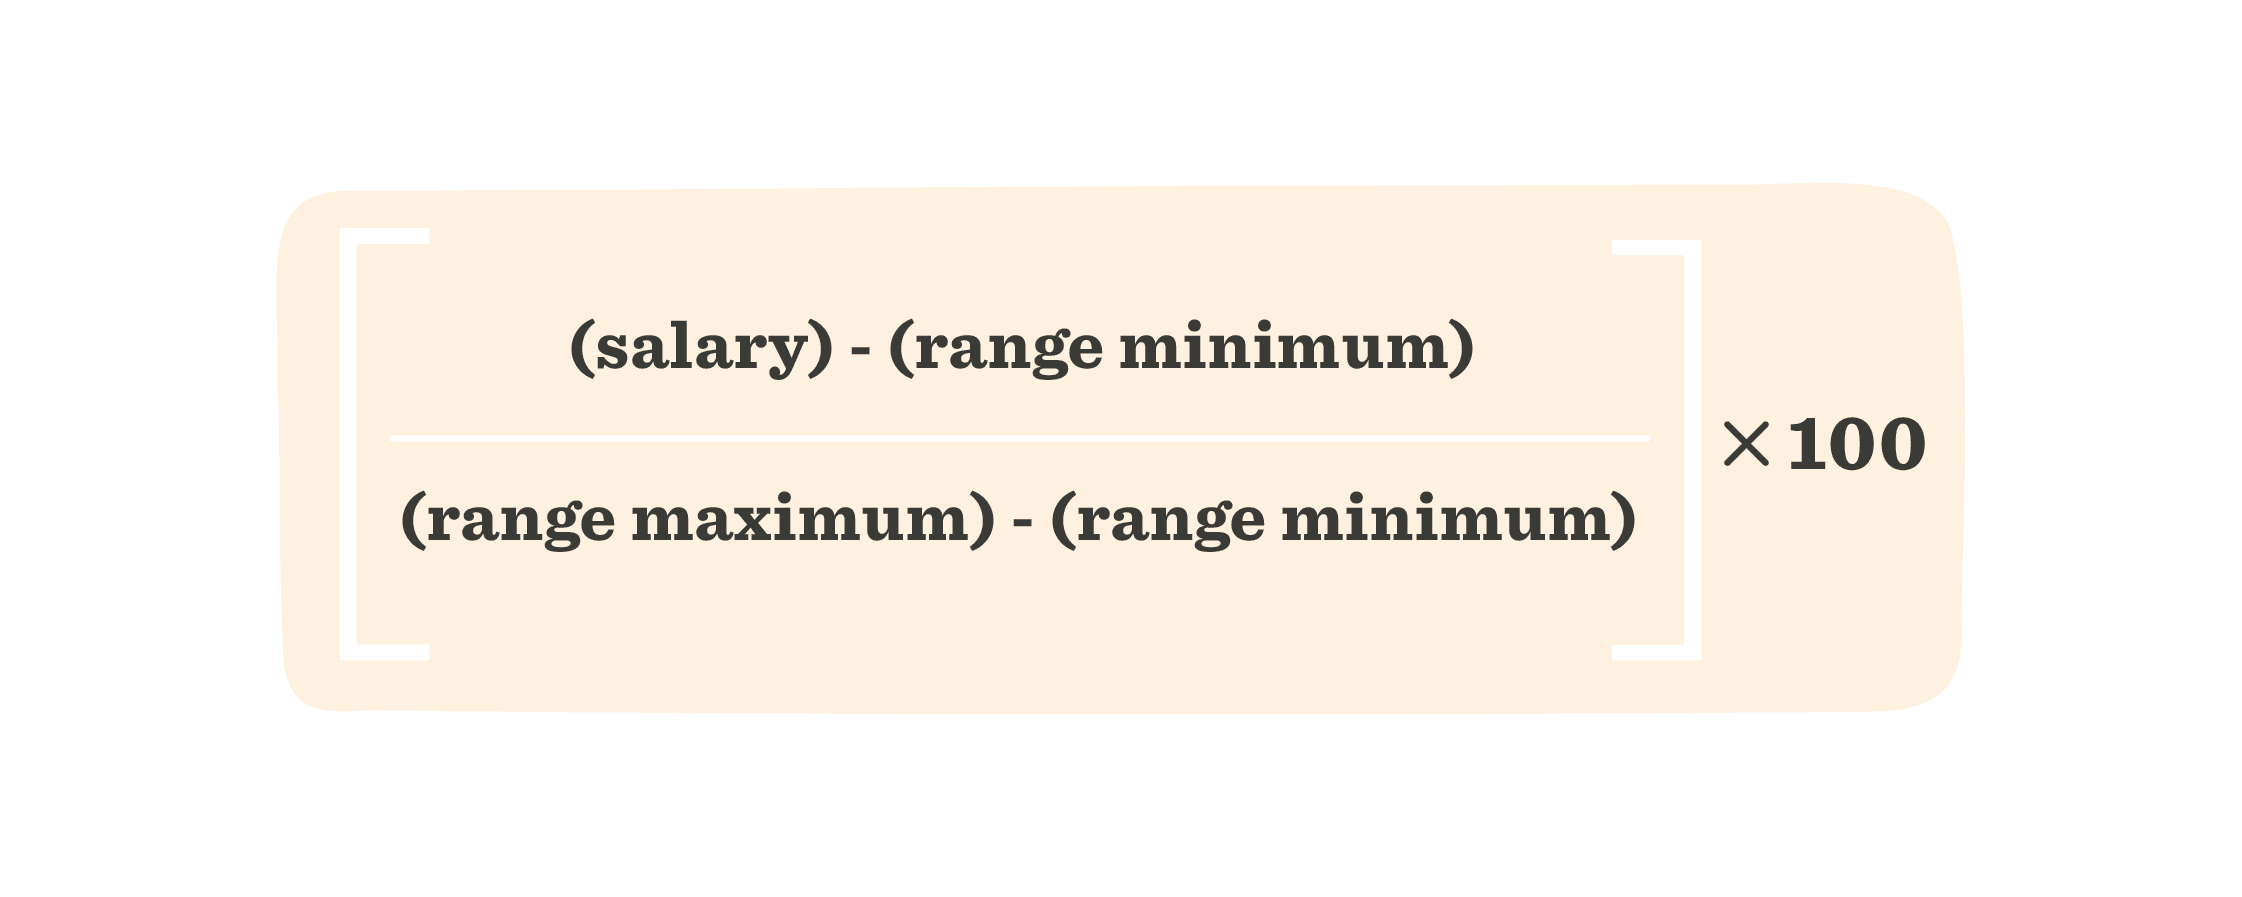
Examining differences in salary range penetration can help reveal pay gap issues. It’s good practice to conduct regular compensation audits and compare compensation for team members in similar roles with similar amounts of experience.
3. Salary average
The salary average is a similar metric used to spot pay gaps. Measure the salary average by team, department, employee demographic, or organization.
To calculate the salary average, add all the salaries in your chosen group and divide by the number of people in that group.
The calculation looks like this:
Salary average is a vital HR metric for understanding diversity, equity, inclusion, and belonging in your organization. By breaking down your salary averages by demographic (age, race, gender, ethnicity, sexual orientation, etc.), you’ll be able to identify any existing inequities in your organization that go beyond roles and their differences.
4. Gender diversity ratio
To understand your teams’ gender breakdown, it’s easiest to measure in ratio form. Using ratios will help you assess how diverse your organization is as a whole, within teams, and in other groups.
The gender diversity ratio is used to determine if there is an equitable or fair representation of people of different genders within your organization. It is most commonly used to measure the ratio of men and women but can also include non-binary people.
To calculate your company’s gender diversity ratio, you’ll need to divide your people into groups based on declared gender and then divide them down to the smallest numbers.
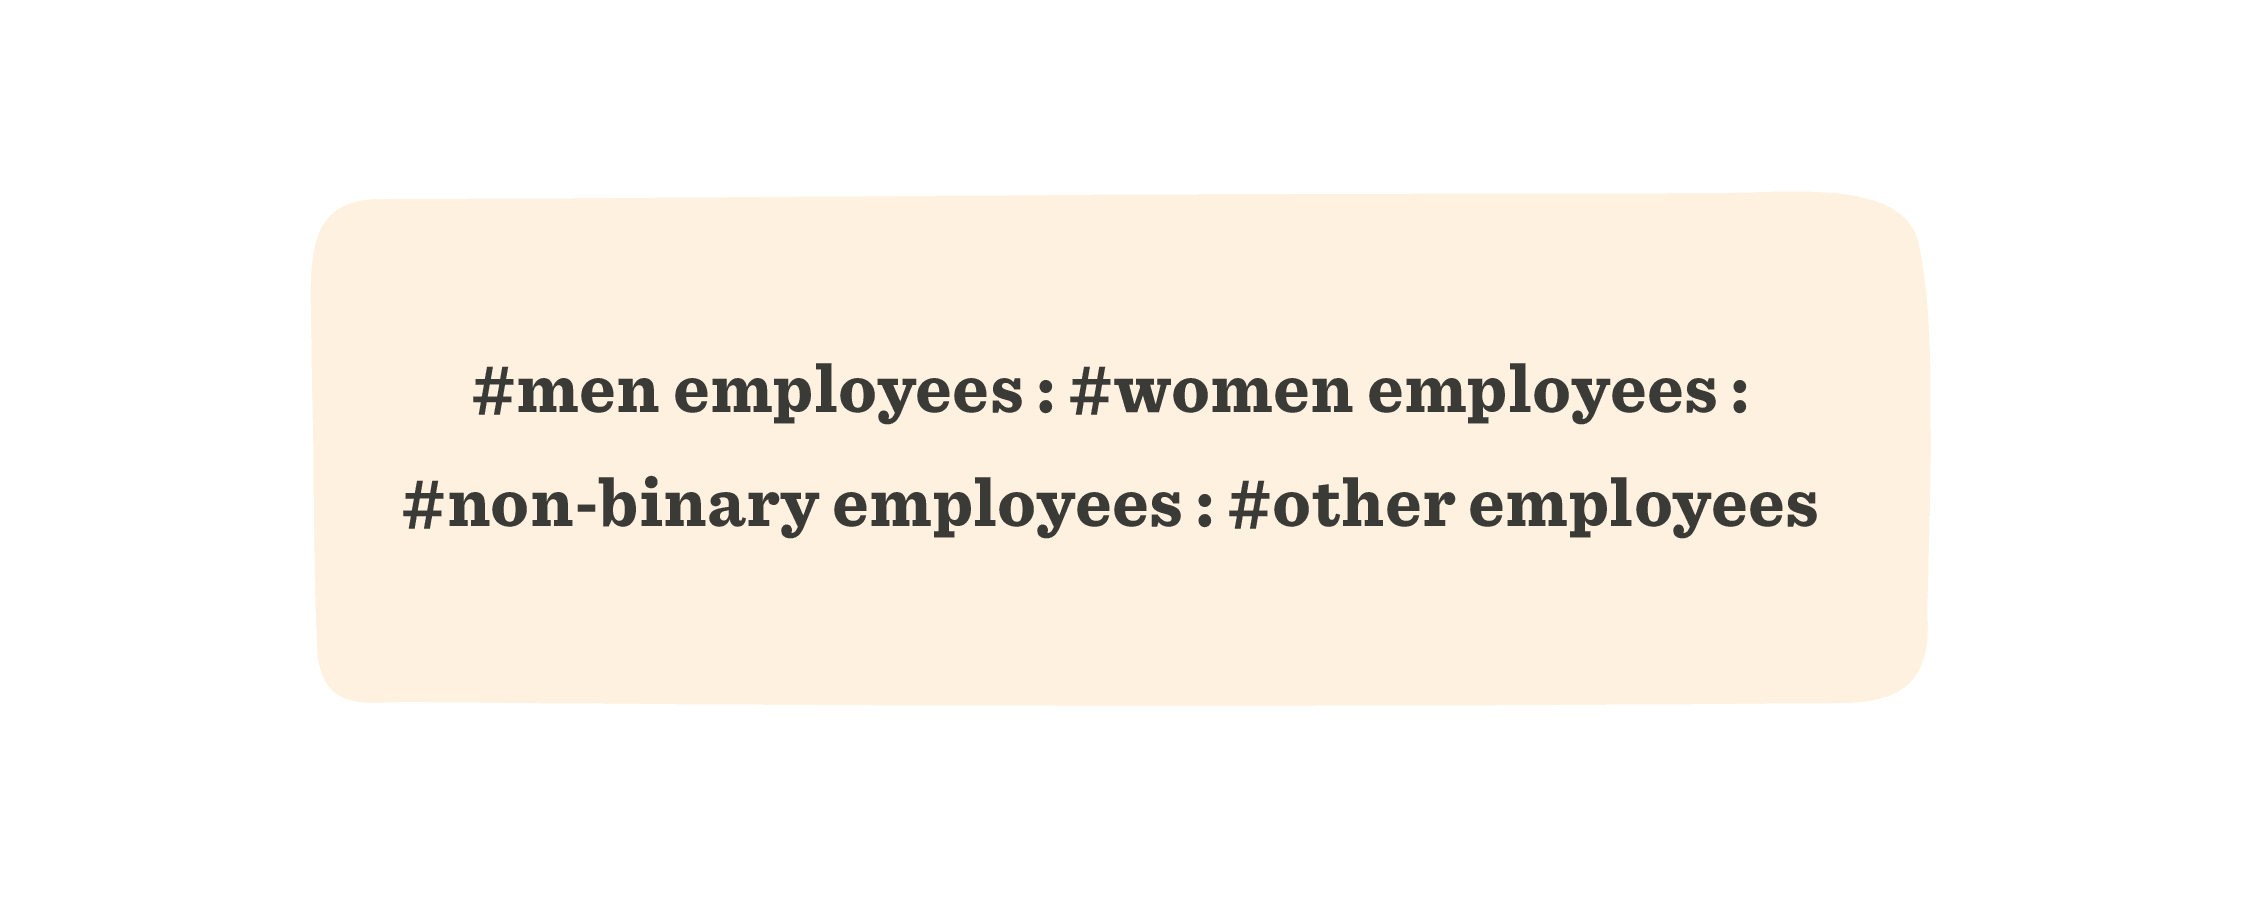
The diversity ratio can also measure the representation of different types of groups within your organization, such as race, ethnicity, or age.
For a company to show that it cares about DEI&B, it must put its money where its mouth is: It must foster an inclusive culture that celebrates diversity and gives people from underrepresented populations a chance to succeed.
By tracking and reviewing these metrics, HR can make sure people from all teams and walks of life are well-represented among their groups and receive fair pay.
5. ERG ratio
Employee Resource Groups (ERGs) help boost DEI&B and company culture, increase belonging, and connect people to the community. You can measure satisfaction and engagement through surveys and participation tracking.
The first step to measuring participation rates is defining what an active member looks like. Use the following formula to find the participation rate of your company’s ERG-sponsored meetings or developmental events.
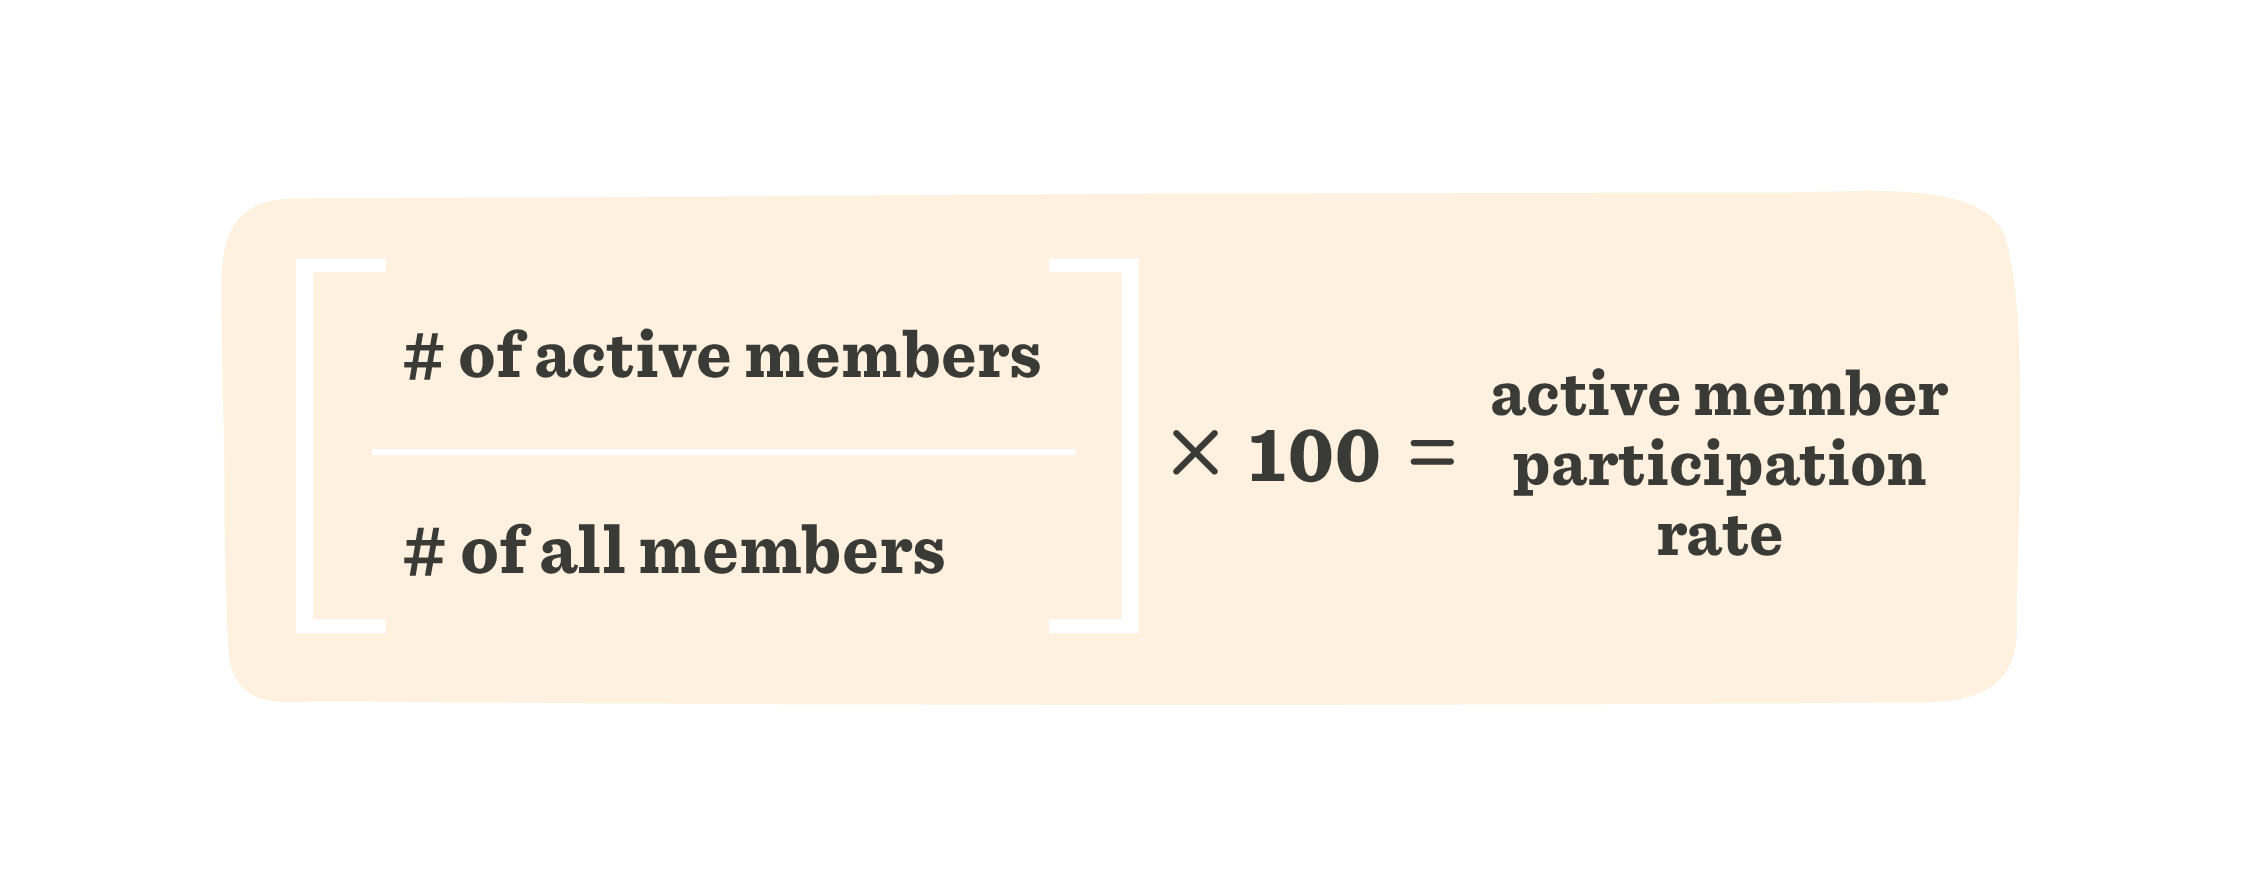
Other metrics could compare members’ promotion and retention rates to nonmembers.
5. DEI&B initiative metrics
Assess the company’s progress on diversity, equity, inclusion, and belonging by measuring awareness of it. You can measure the percentage of employees or customers who know about the company’s commitment to DEI&B or who engage in online discussions about related topics. If you’ve established specific goals, such as establishing a mentorship program, track your company’s progress on those.
Measuring some aspects of DEI&B, like recruiting and retention, is straightforward. If you want to improve diversity in hiring, start with your applicant pool.
One formula to assess if you’re including enough people in your candidate pool is:
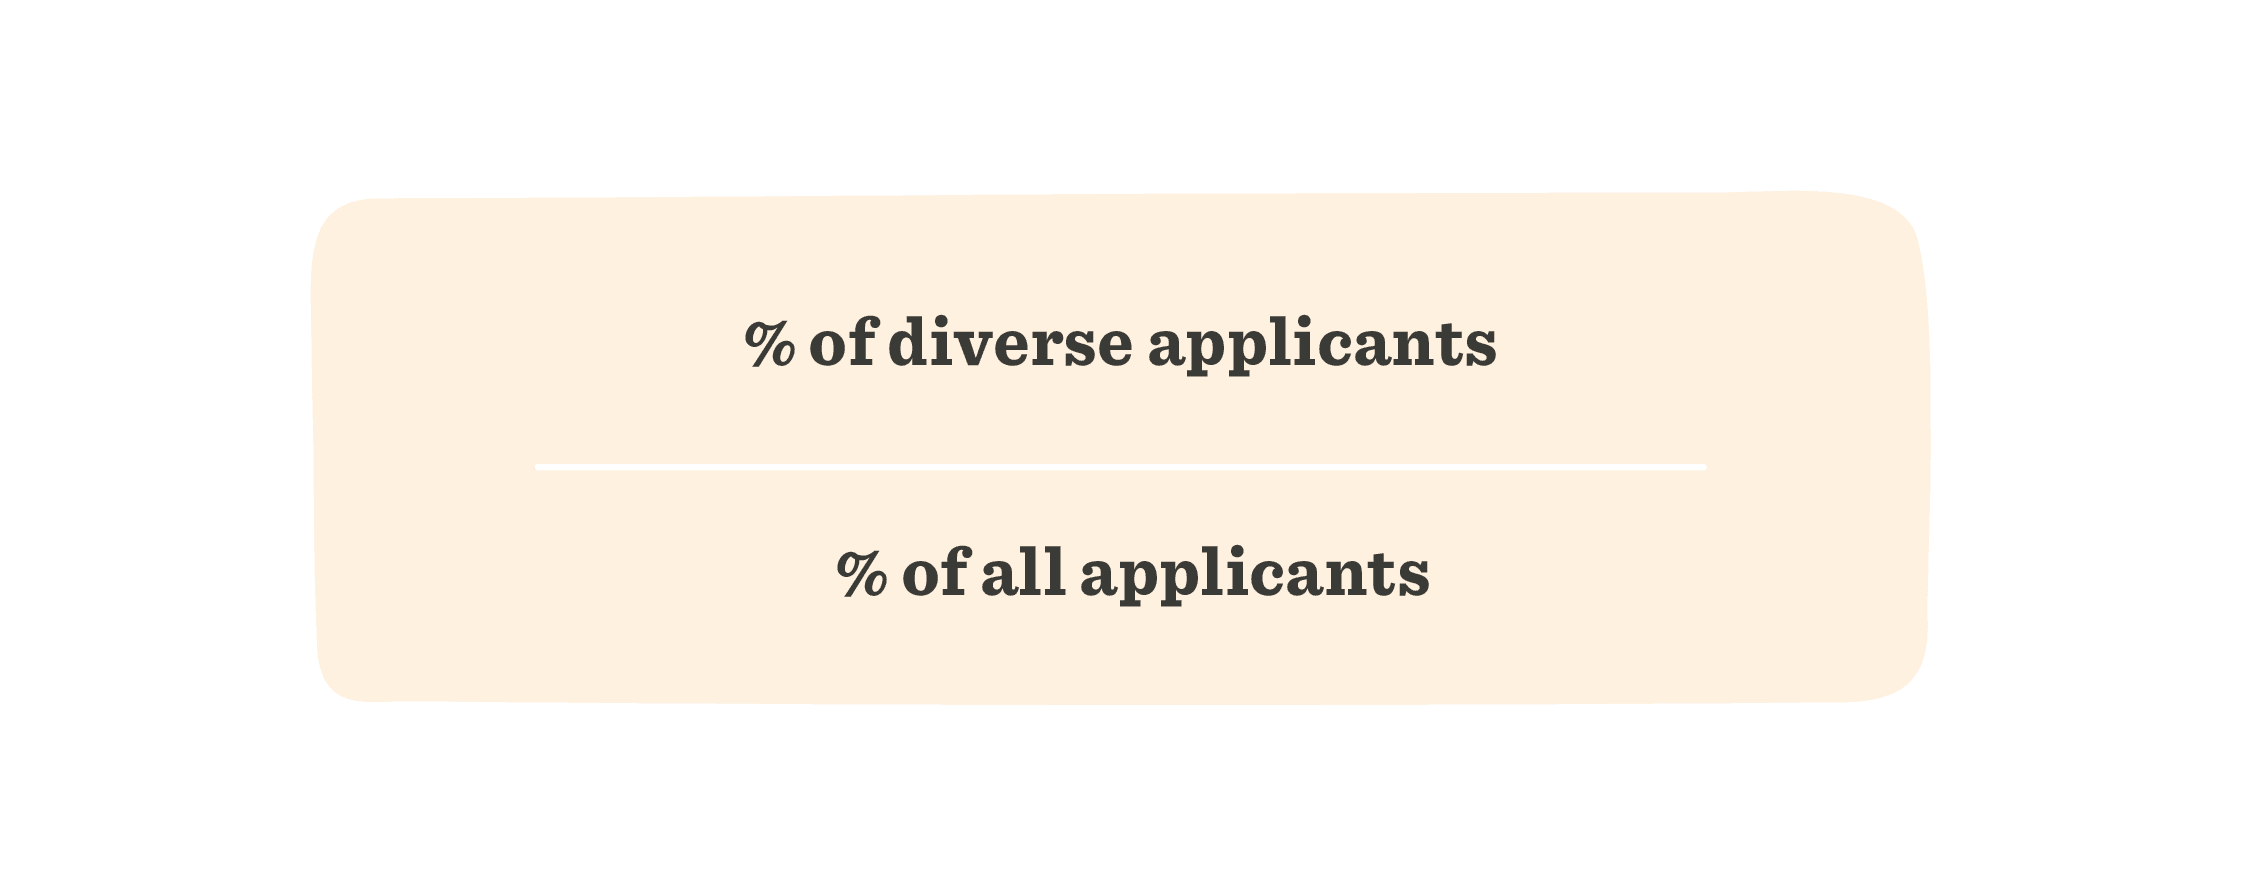
Next, look at the percentage of diverse candidates hired compared to all candidates hired. Dig a little deeper into what jobs (and what salaries) the candidates accepted. If the majority of diverse candidates accepted lower-level jobs or similar jobs at lower salaries, this requires a closer look.
Collecting metrics for inclusion and belonging is more complex. People who don’t feel included will leave the company. Look at turnover by demographics for teams and departments. Examine when women and people of color get promoted versus their counterparts. Performance and opportunities will impact this statistic, but you can still look for trends that might indicate an issue.
The demographics of a department or company board can also point to inclusion issues, especially if those groups consist of long-time colleagues and acquaintances. Dig deeper with surveys to find out if people feel respected, valued, and involved.

Retention
Employee retention will always be a top concern for HR, recruiters, and management. Keeping retention rates high helps companies save on recruiting and onboarding costs while increasing employee loyalty and trust.
Below are several key metrics to help measure retention.
1. eNPS (employee net promoter score)
eNPS is a metric that assesses people’s job satisfaction by measuring their willingness to recommend their current company to others. If people want their friends to get on board, it’s safe to say they’re reasonably satisfied working at the company. If they’re telling their pals to stay away, it’s a sign of bigger problems.
Of all the HR metrics, eNPS is the easiest to measure. Send people a survey and ask, “On a scale from 0-10, how likely are you to recommend this company as a place to work?”
Divide people into “promoters” (9-10), “passives” (7-8), and “detractors” (0-6).
The formula for eNPS is:
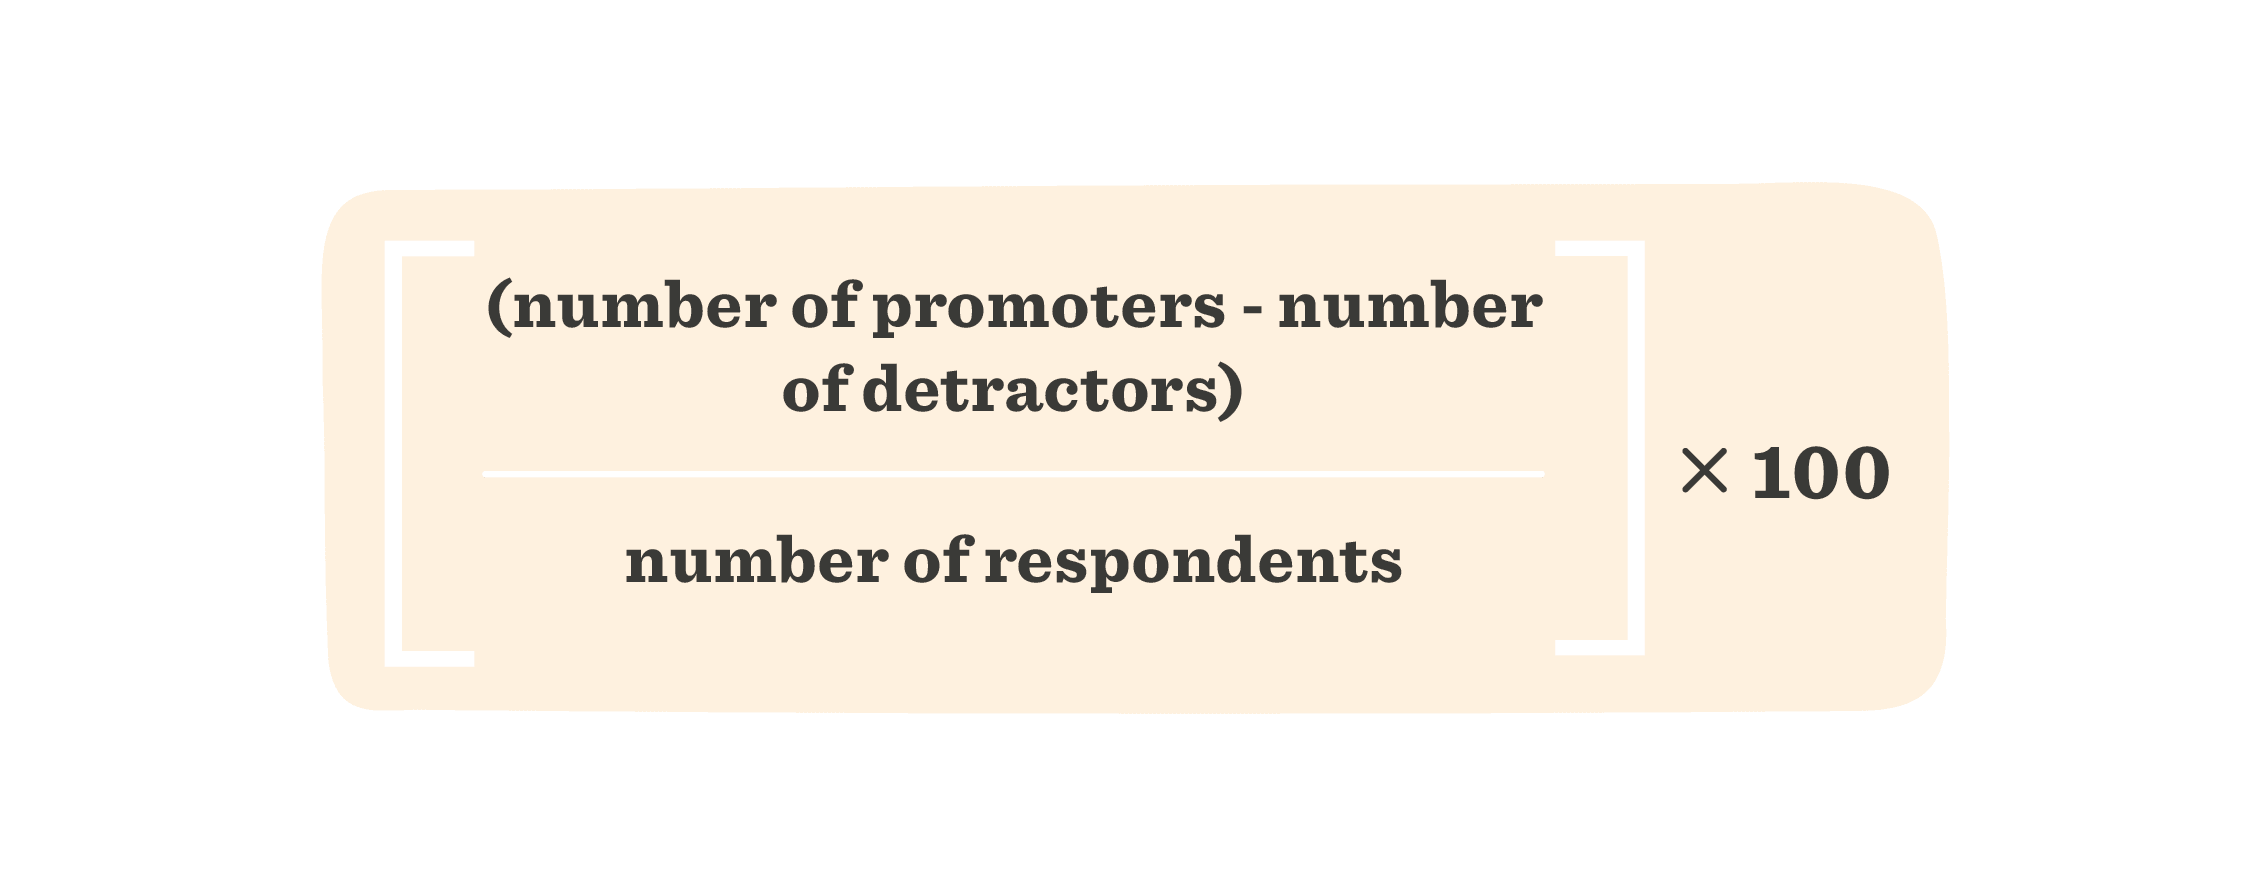
A score between 10 and 20 is reasonable, 20 and 30 is good, and 40 and 50 is outstanding. In designing the survey, it’s best to include room for open-ended answers which can help locate areas for improvement.
For a more thorough analysis, organize results in various ways, such as by department, role, length of employment, or even gender, age, and race. This can help determine if any issues are company-wide or related to specific groups.
Companies usually run eNPS surveys every three to six months. This continuous process allows your people to offer constructive feedback, collaborate with managers, and share collective responsibility.
2. Career Path Ratio
Your people should feel empowered to move in all directions.
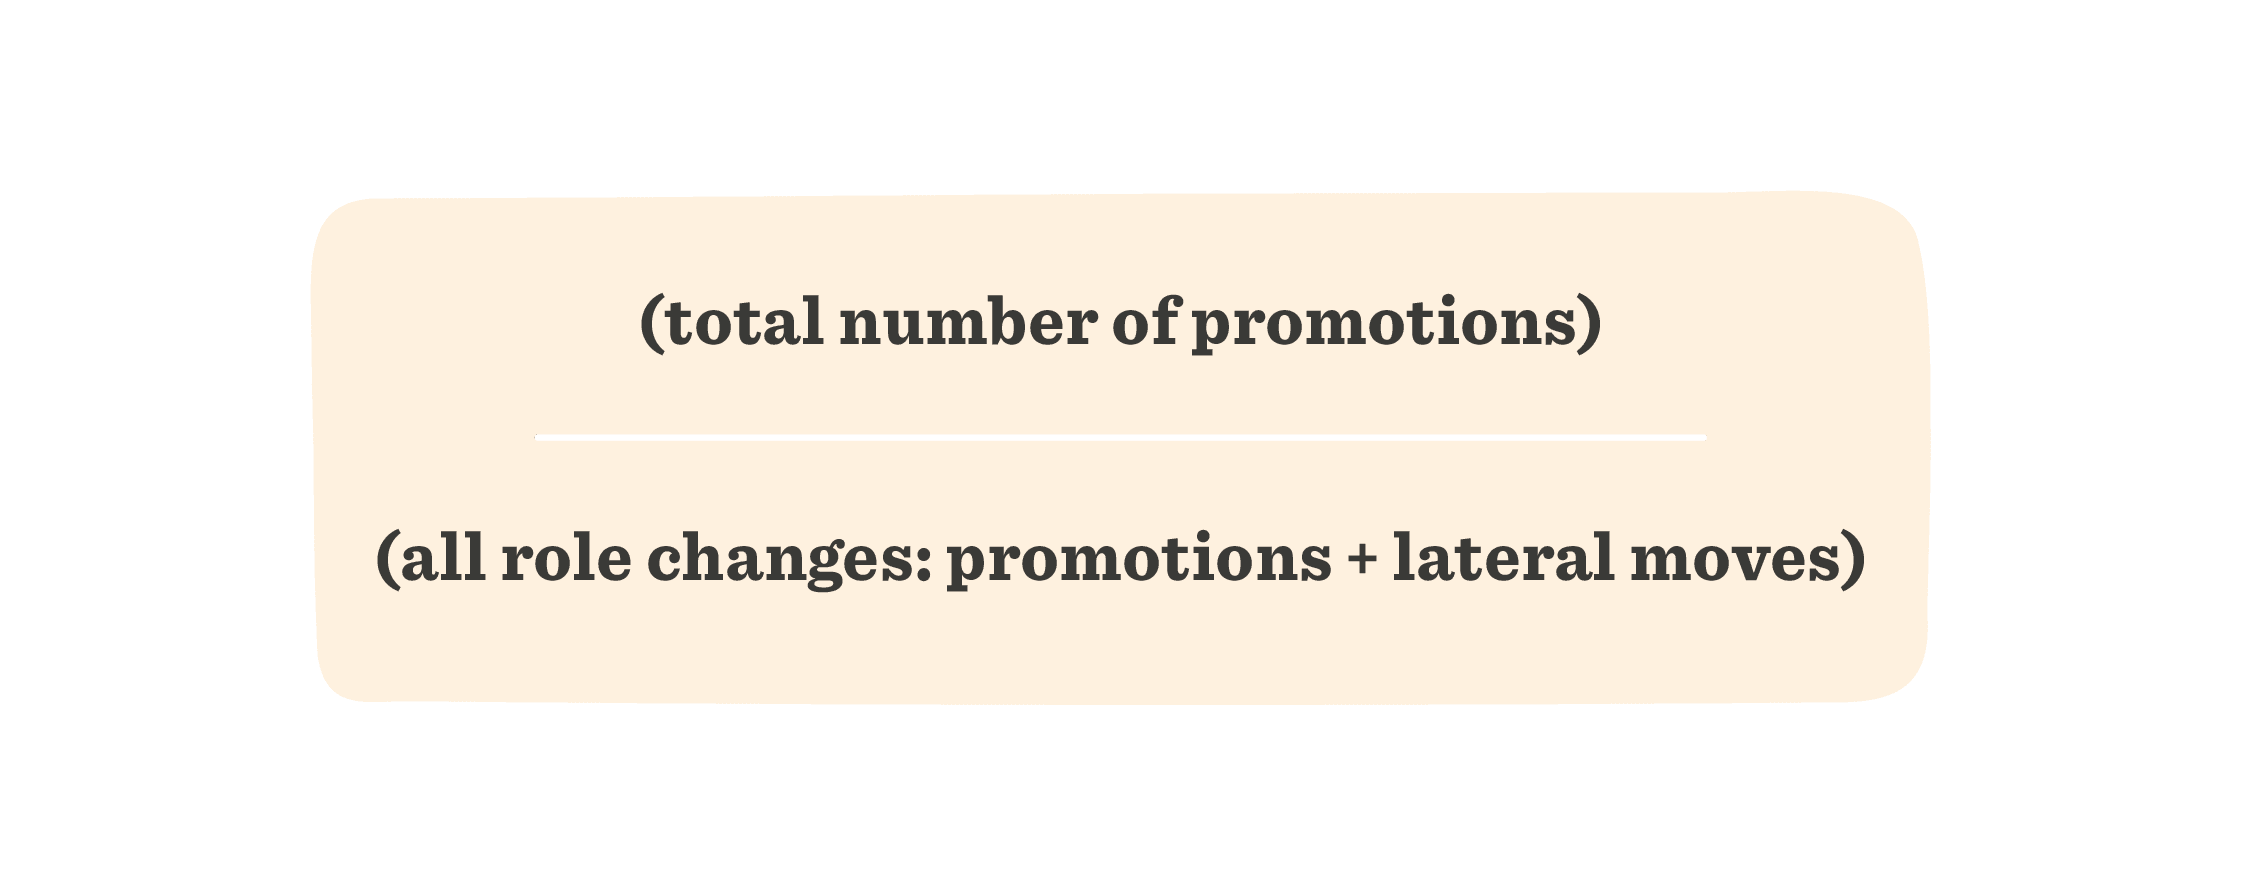
Using the career path ratio, HR can keep track of promotions and lateral moves to see how employees are growing, changing, and adapting within the organization.
To calculate this metric, divide the total number of promotions by the sum of all upward and lateral role changes. Start with a lookback period of at least a year to ensure there’s enough data.
This number is easy to calculate for companies with clear org charts and distinct job titles and tiers. The trickier part is understanding where and how to improve. Providing several growth tracks and encouraging promotion from within is critical.
When movement is strictly vertical, professionals who have reached their promotional ceiling can feel “stuck.” An organization that is too “top-heavy” might unintentionally push great people away. And companies that discourage lateral moves can find people growing bored and leaving.
To understand the cause of a retention issue, examining the career path ratio is a great place to start.
3. Salary change
People want to feel that they are growing within their companies, both in their career path and salary. A company that doesn’t increase wages over time is more likely to see a higher attrition rate as people leave for companies that will pay them more.
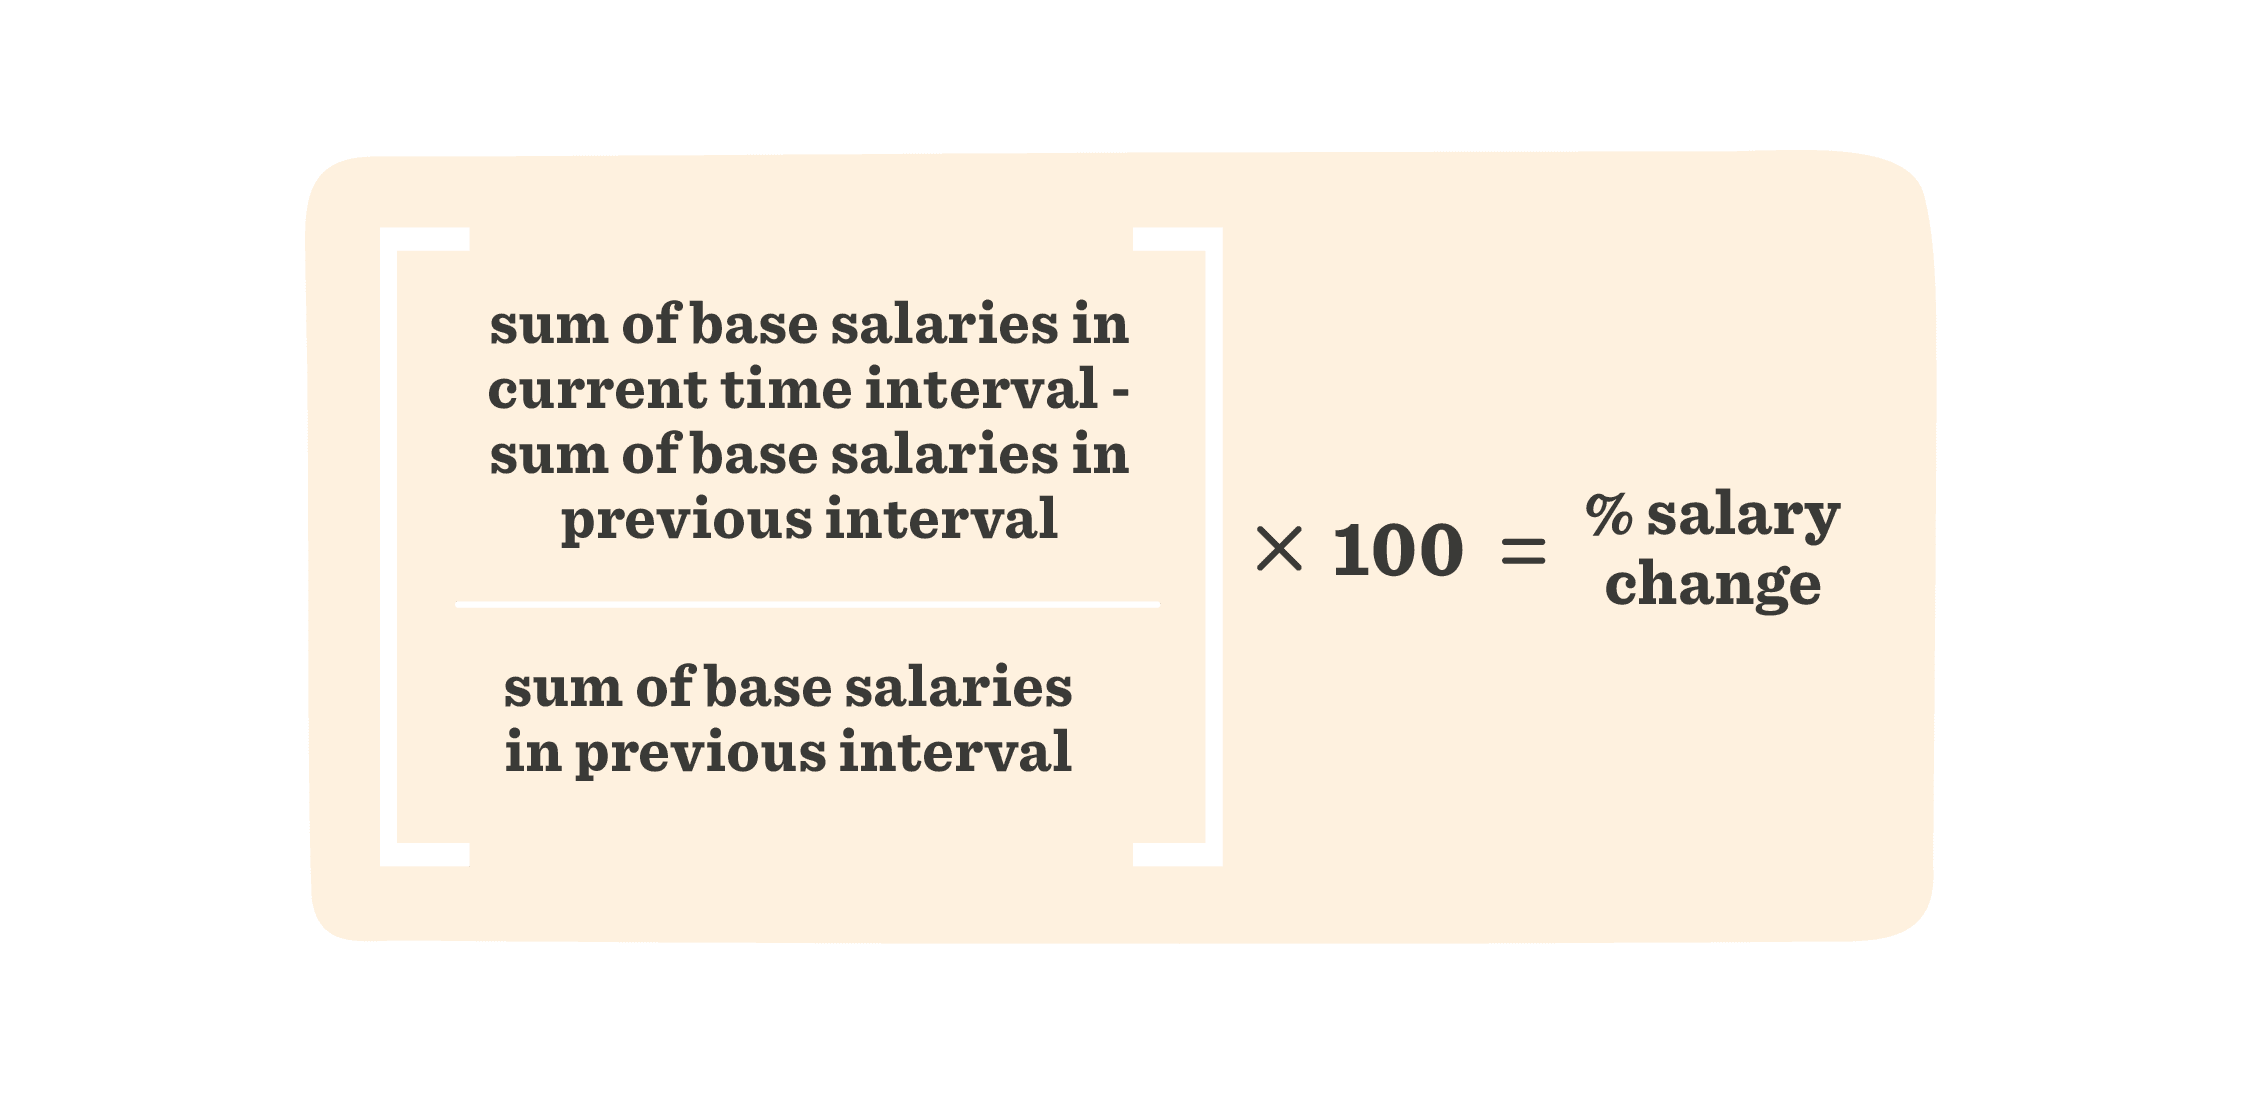
The salary change KPI presents your company’s base salary changes over time and helps you to make informed salary cost estimates and projections.
To calculate salary change, you measure the difference between the sum of base salary values over two periods of time and divide by the sum of base salaries in the previous time interval. Then, multiply this number by 100 for a percentage salary change.
You can calculate salary change across the entire company or filter by team, department, or a specific segment or group. A low percentage indicates few salary increases among this group, which can impact employee retention.
4. Absenteeism rates
When absences become habitual or are taken without good reason, they can cause a drag on productivity. If one person is unreliable, the whole team feels it. That’s why when we talk about absenteeism, we distinguish between excused and unexcused absences.
Excused absences are scheduled in advance, giving the rest of the team enough time to shift the workload. Unexcused absences arrive without warning and can leave teams in the weeds. Sick days and other unplanned absences will happen, but when they keep happening and for no excusable reason, leaders need to address them.
For example, according to HR Dive, absences related to COVID “cost employers more than $78.4 billion — nearly $1 billion each week.”
To calculate a company’s absenteeism rate, divide the number of unexcused absences by the amount of time being measured, and multiply the result by 100.
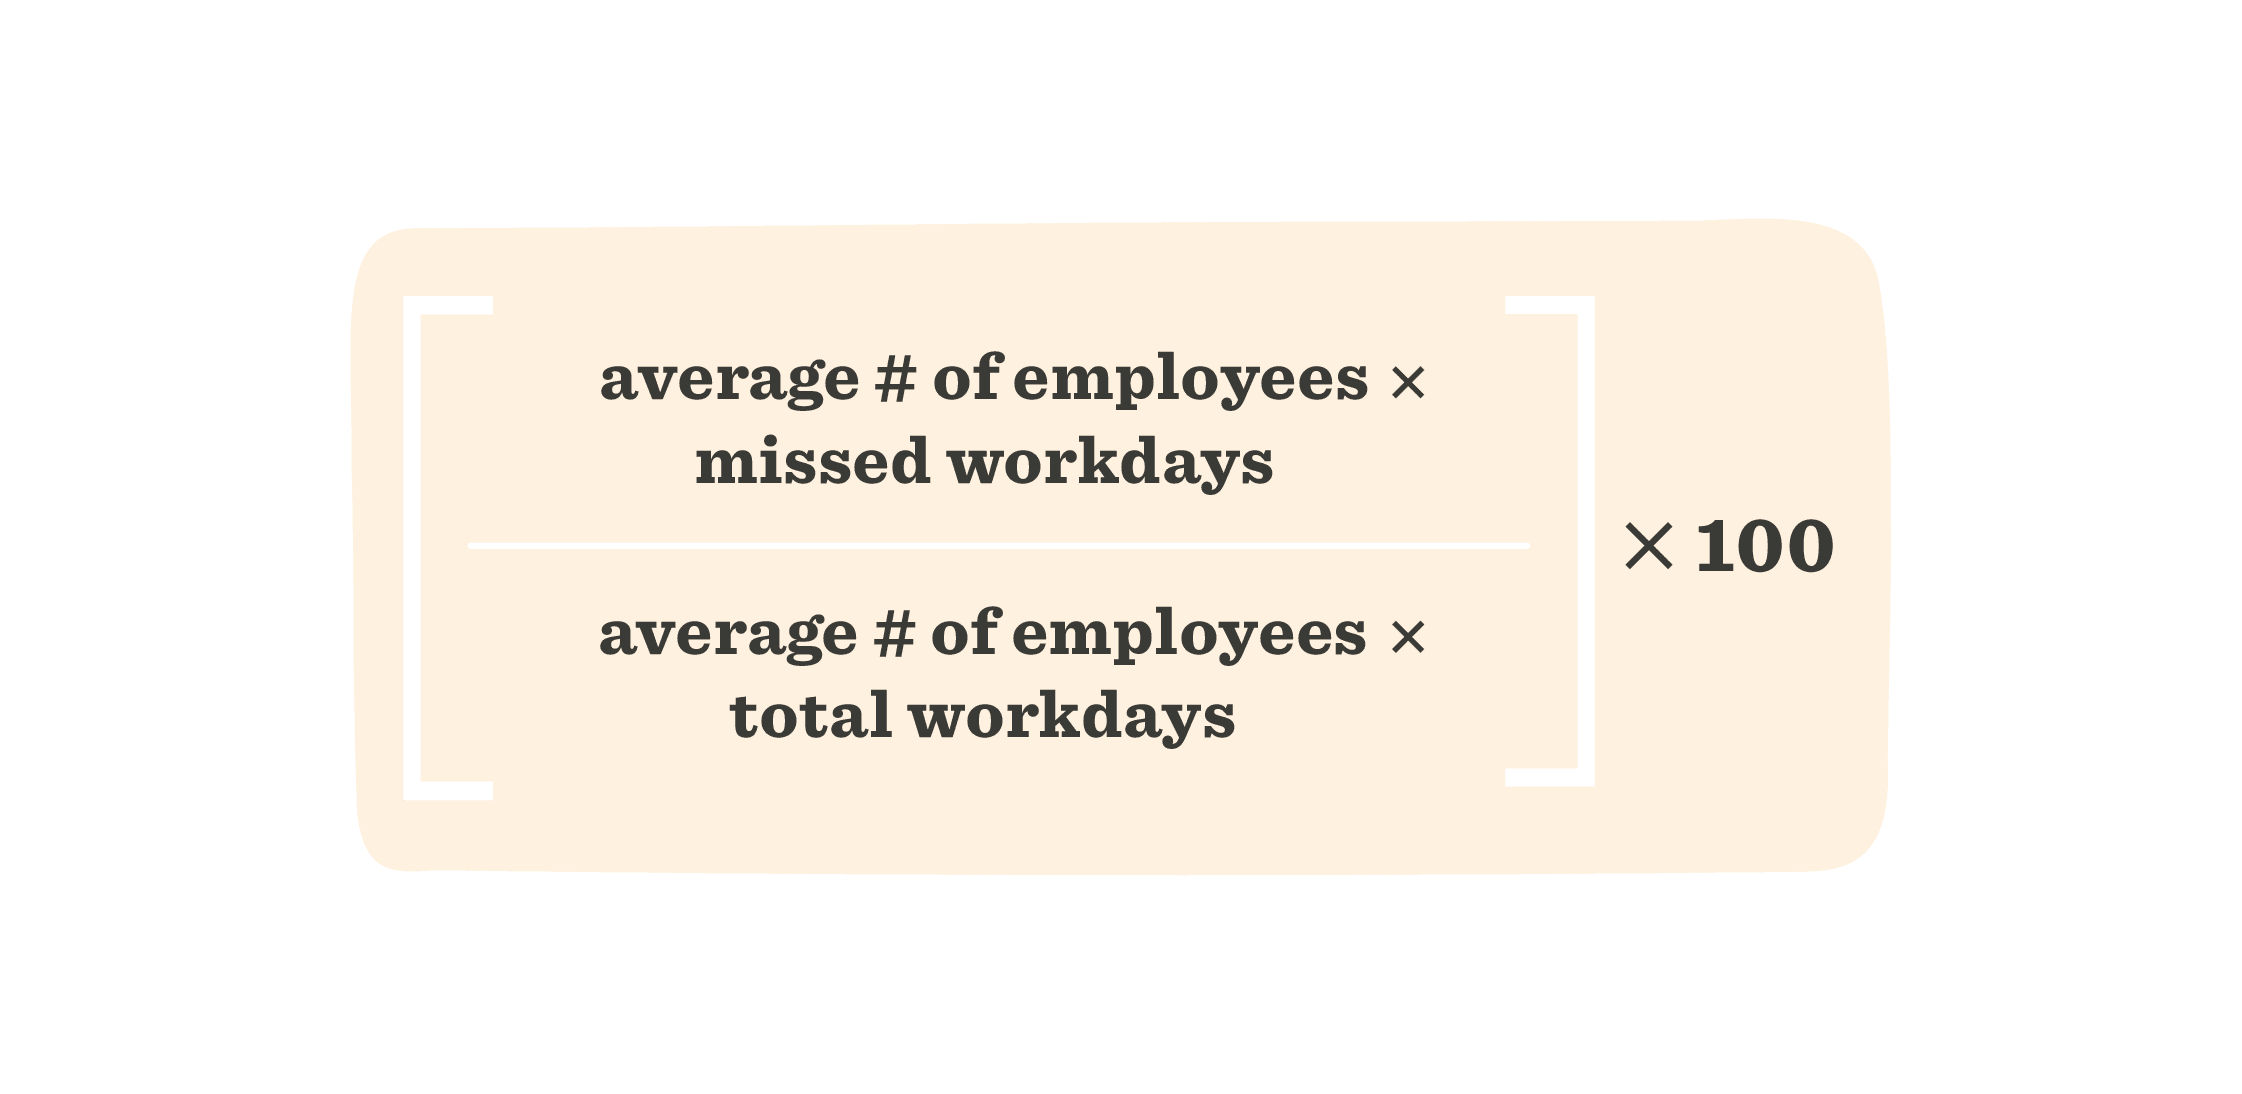
A company’s absenteeism rate should be as close to zero as possible.
There are many causes of absenteeism, such as bad management, workplace stress, burnout, and general feelings associated with disengaged employees, such as feeling undervalued or that their work has no impact.
However, there may also be other reasons. The Bradford Factor is a specific type of absenteeism measurement that measures individuals and the duration and frequency of absenteeism.
To measure someone’s Bradford Factor, use the Bradford formula:

Here, “S” is for “spells,” meaning the number of absences over a set period. Square this number and then multiply it by “D” for “days,” meaning the total number of days a person was absent.
The Bradford Factor doesn’t just measure the number of days off but focuses on the number of absences. It is based on the theory that shorter, more frequent absences are more detrimental to the organization than longer, less frequent ones.
When you use the Bradford Factor, a higher score reflects a more significant negative impact on the business. A score of less than 50 should not merit concern. This is the one HR metric where a lower score is better.
If you see a team member routinely taking short absences, it could be a warning sign about their health and/or wellbeing, not necessarily about their attitude about work. In this case, scheduling a one-on-one to discuss their situation may help them get the resources needed to address any issues.
5. Presenteeism rates
Presenteeism occurs when people are at work but aren’t engaged. They might be sick, burned out, or working in a toxic environment. Regardless of the cause, experts have estimated that presenteeism costs companies more than $150 billion in lost productivity.
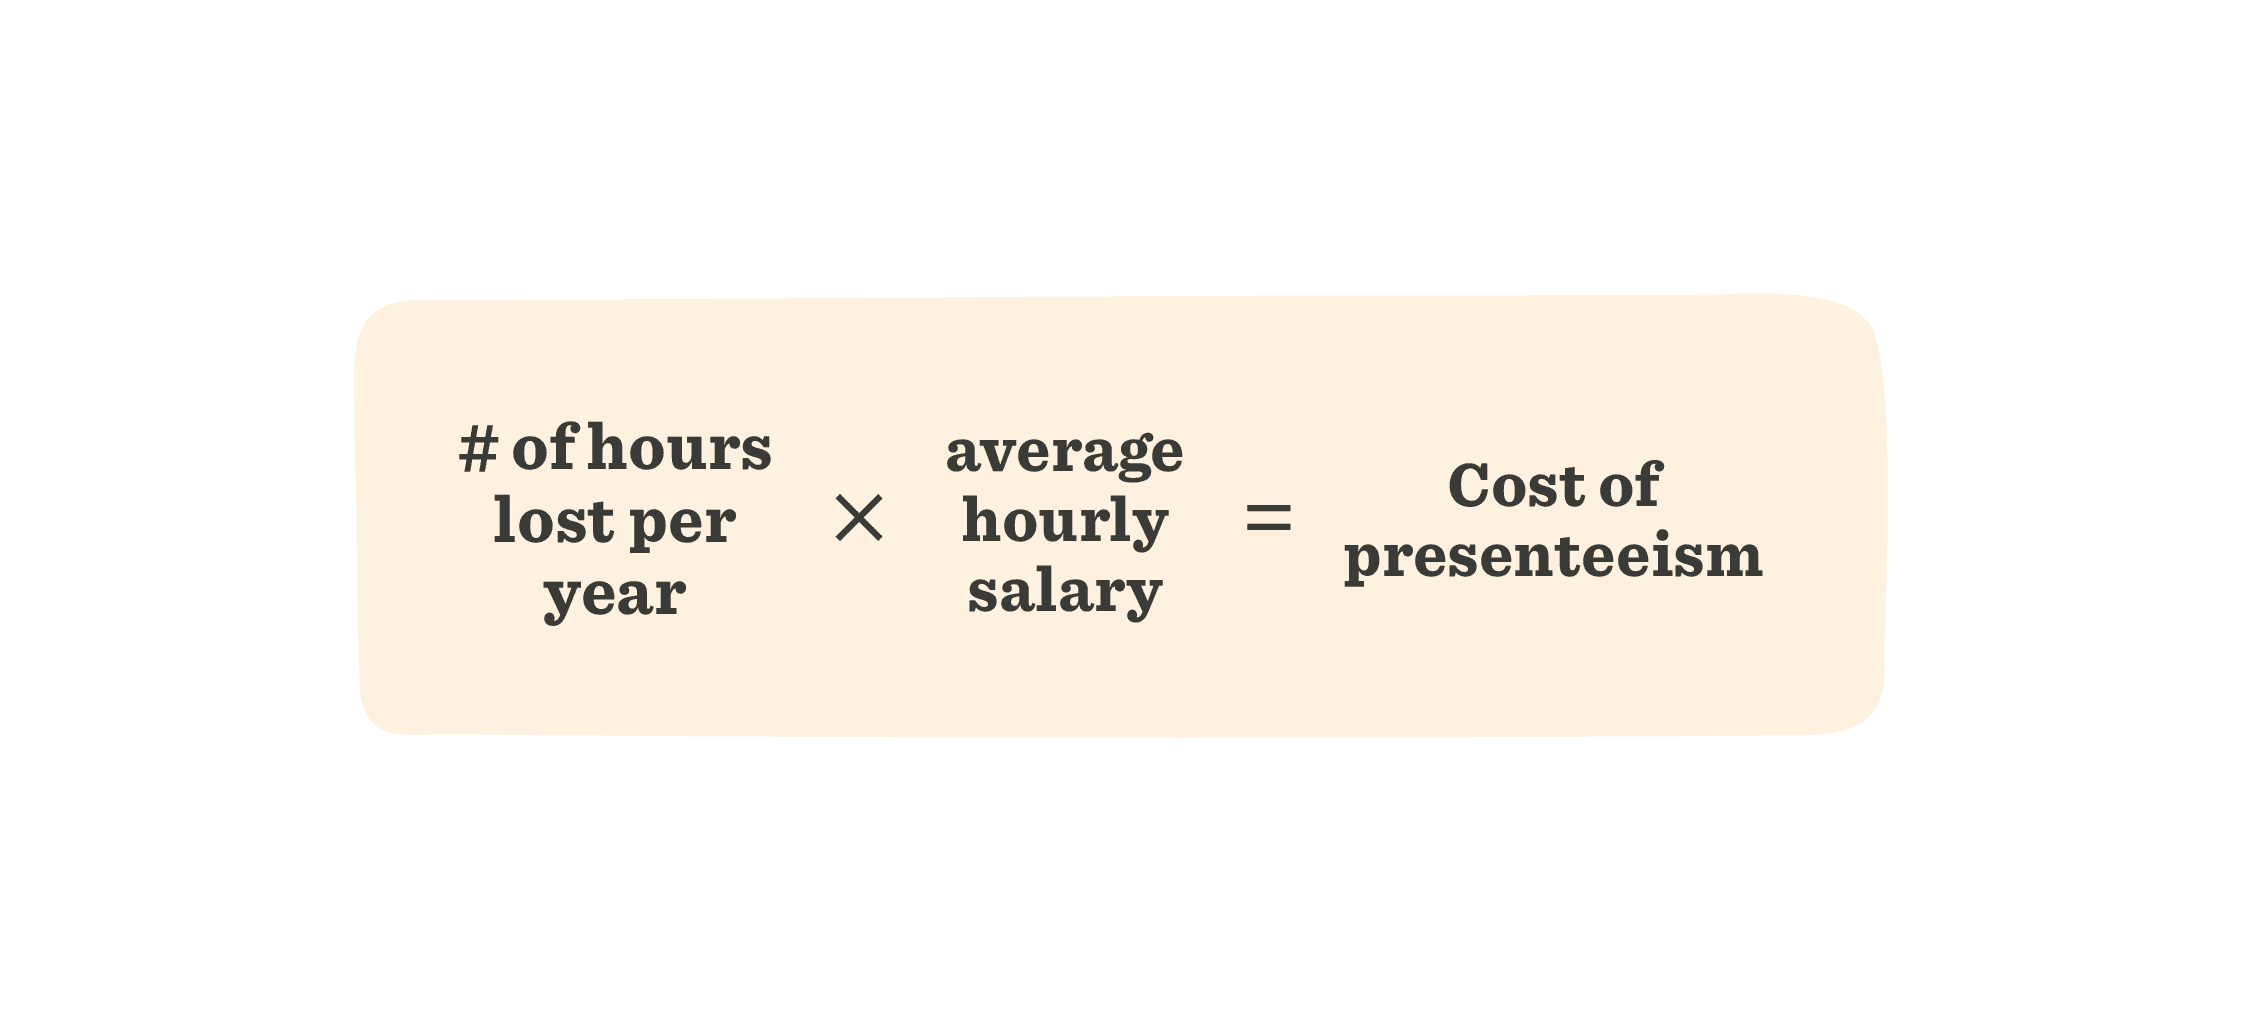
Presenteeism is more challenging to calculate than absenteeism, but you can get a general idea by surveying your people with questions like, “What percentage of the week are you at work but unproductive?” Let’s say the average answer is 10 percent. With that number, you can use this formula:
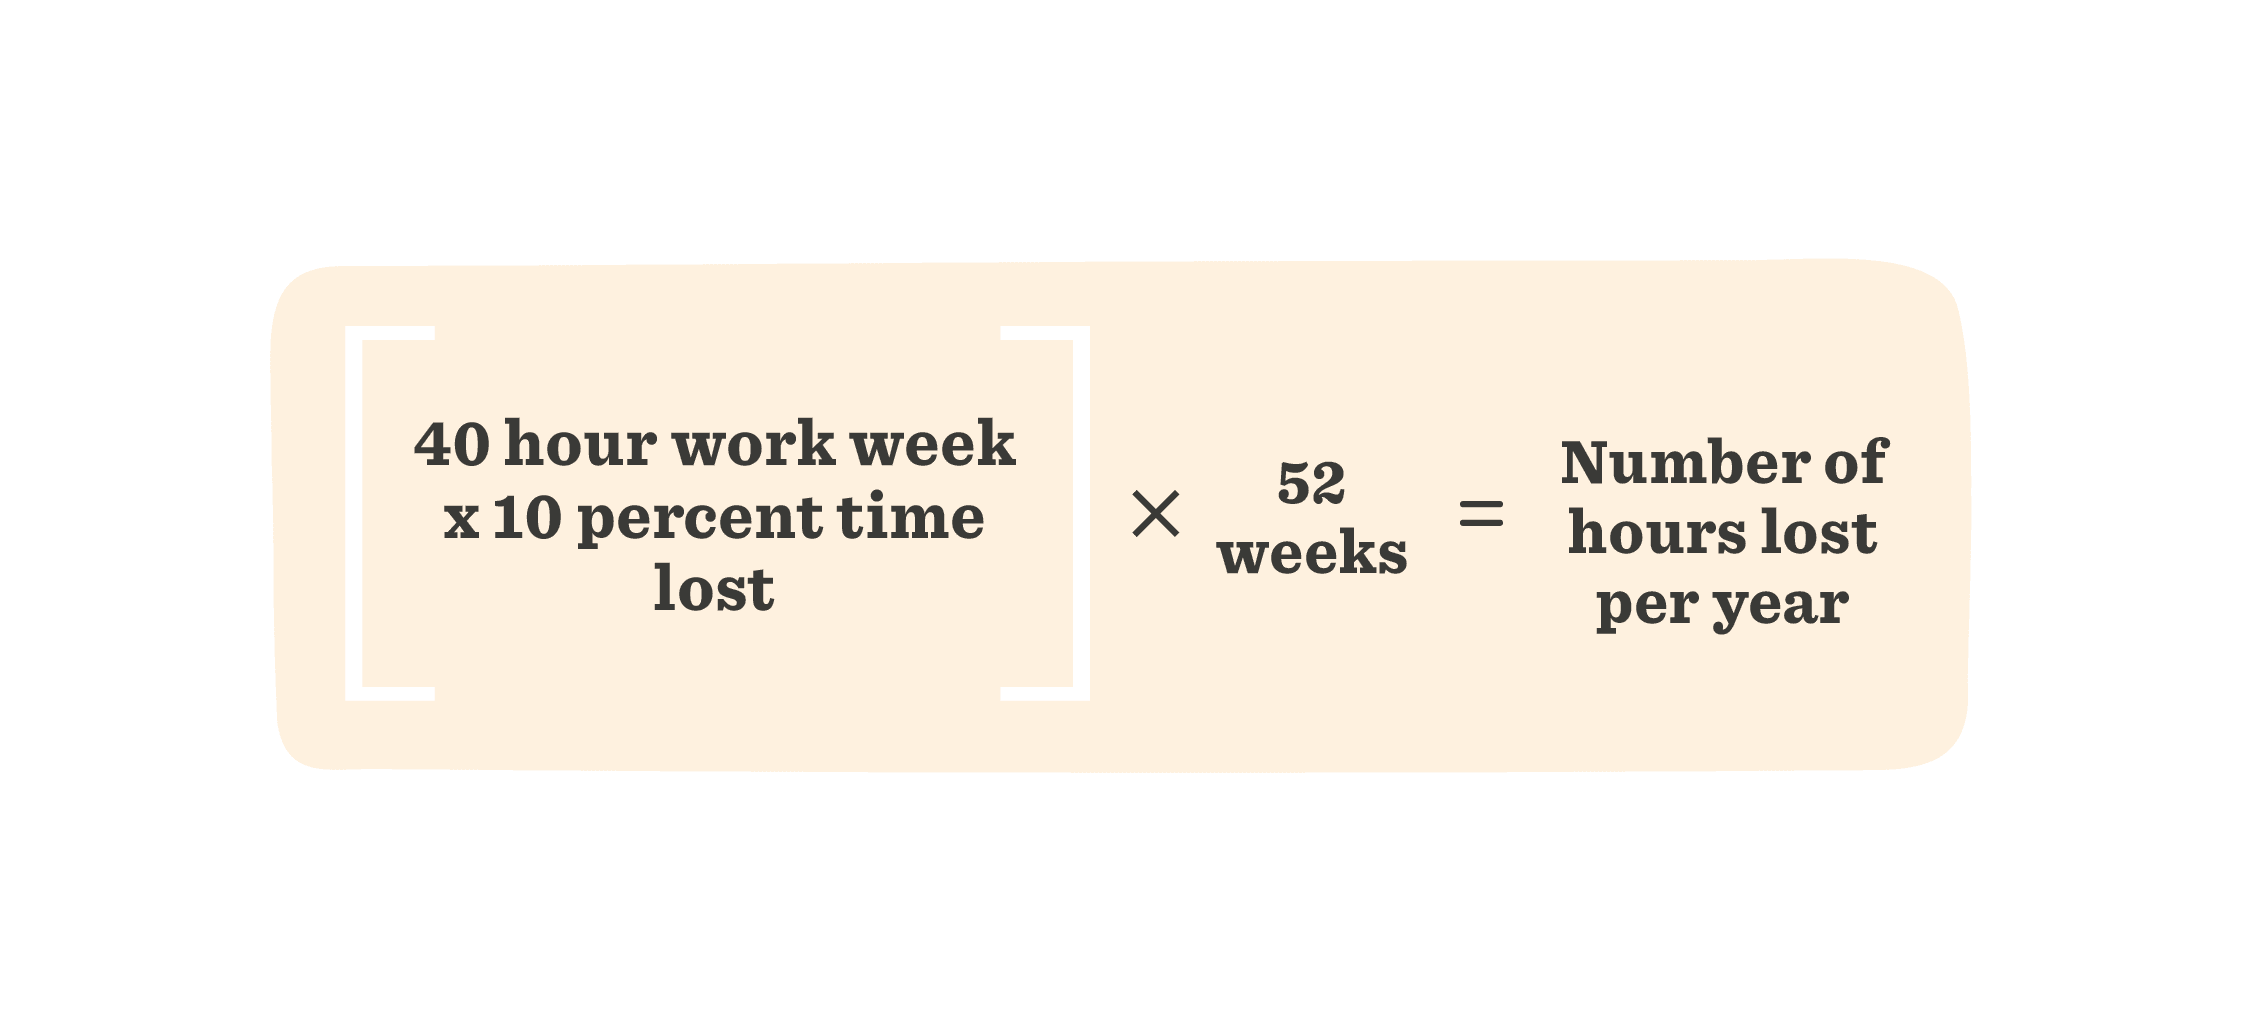
To get the total cost, multiply the number of hours lost per year by the organization’s average hourly salary.
6. Learning and development
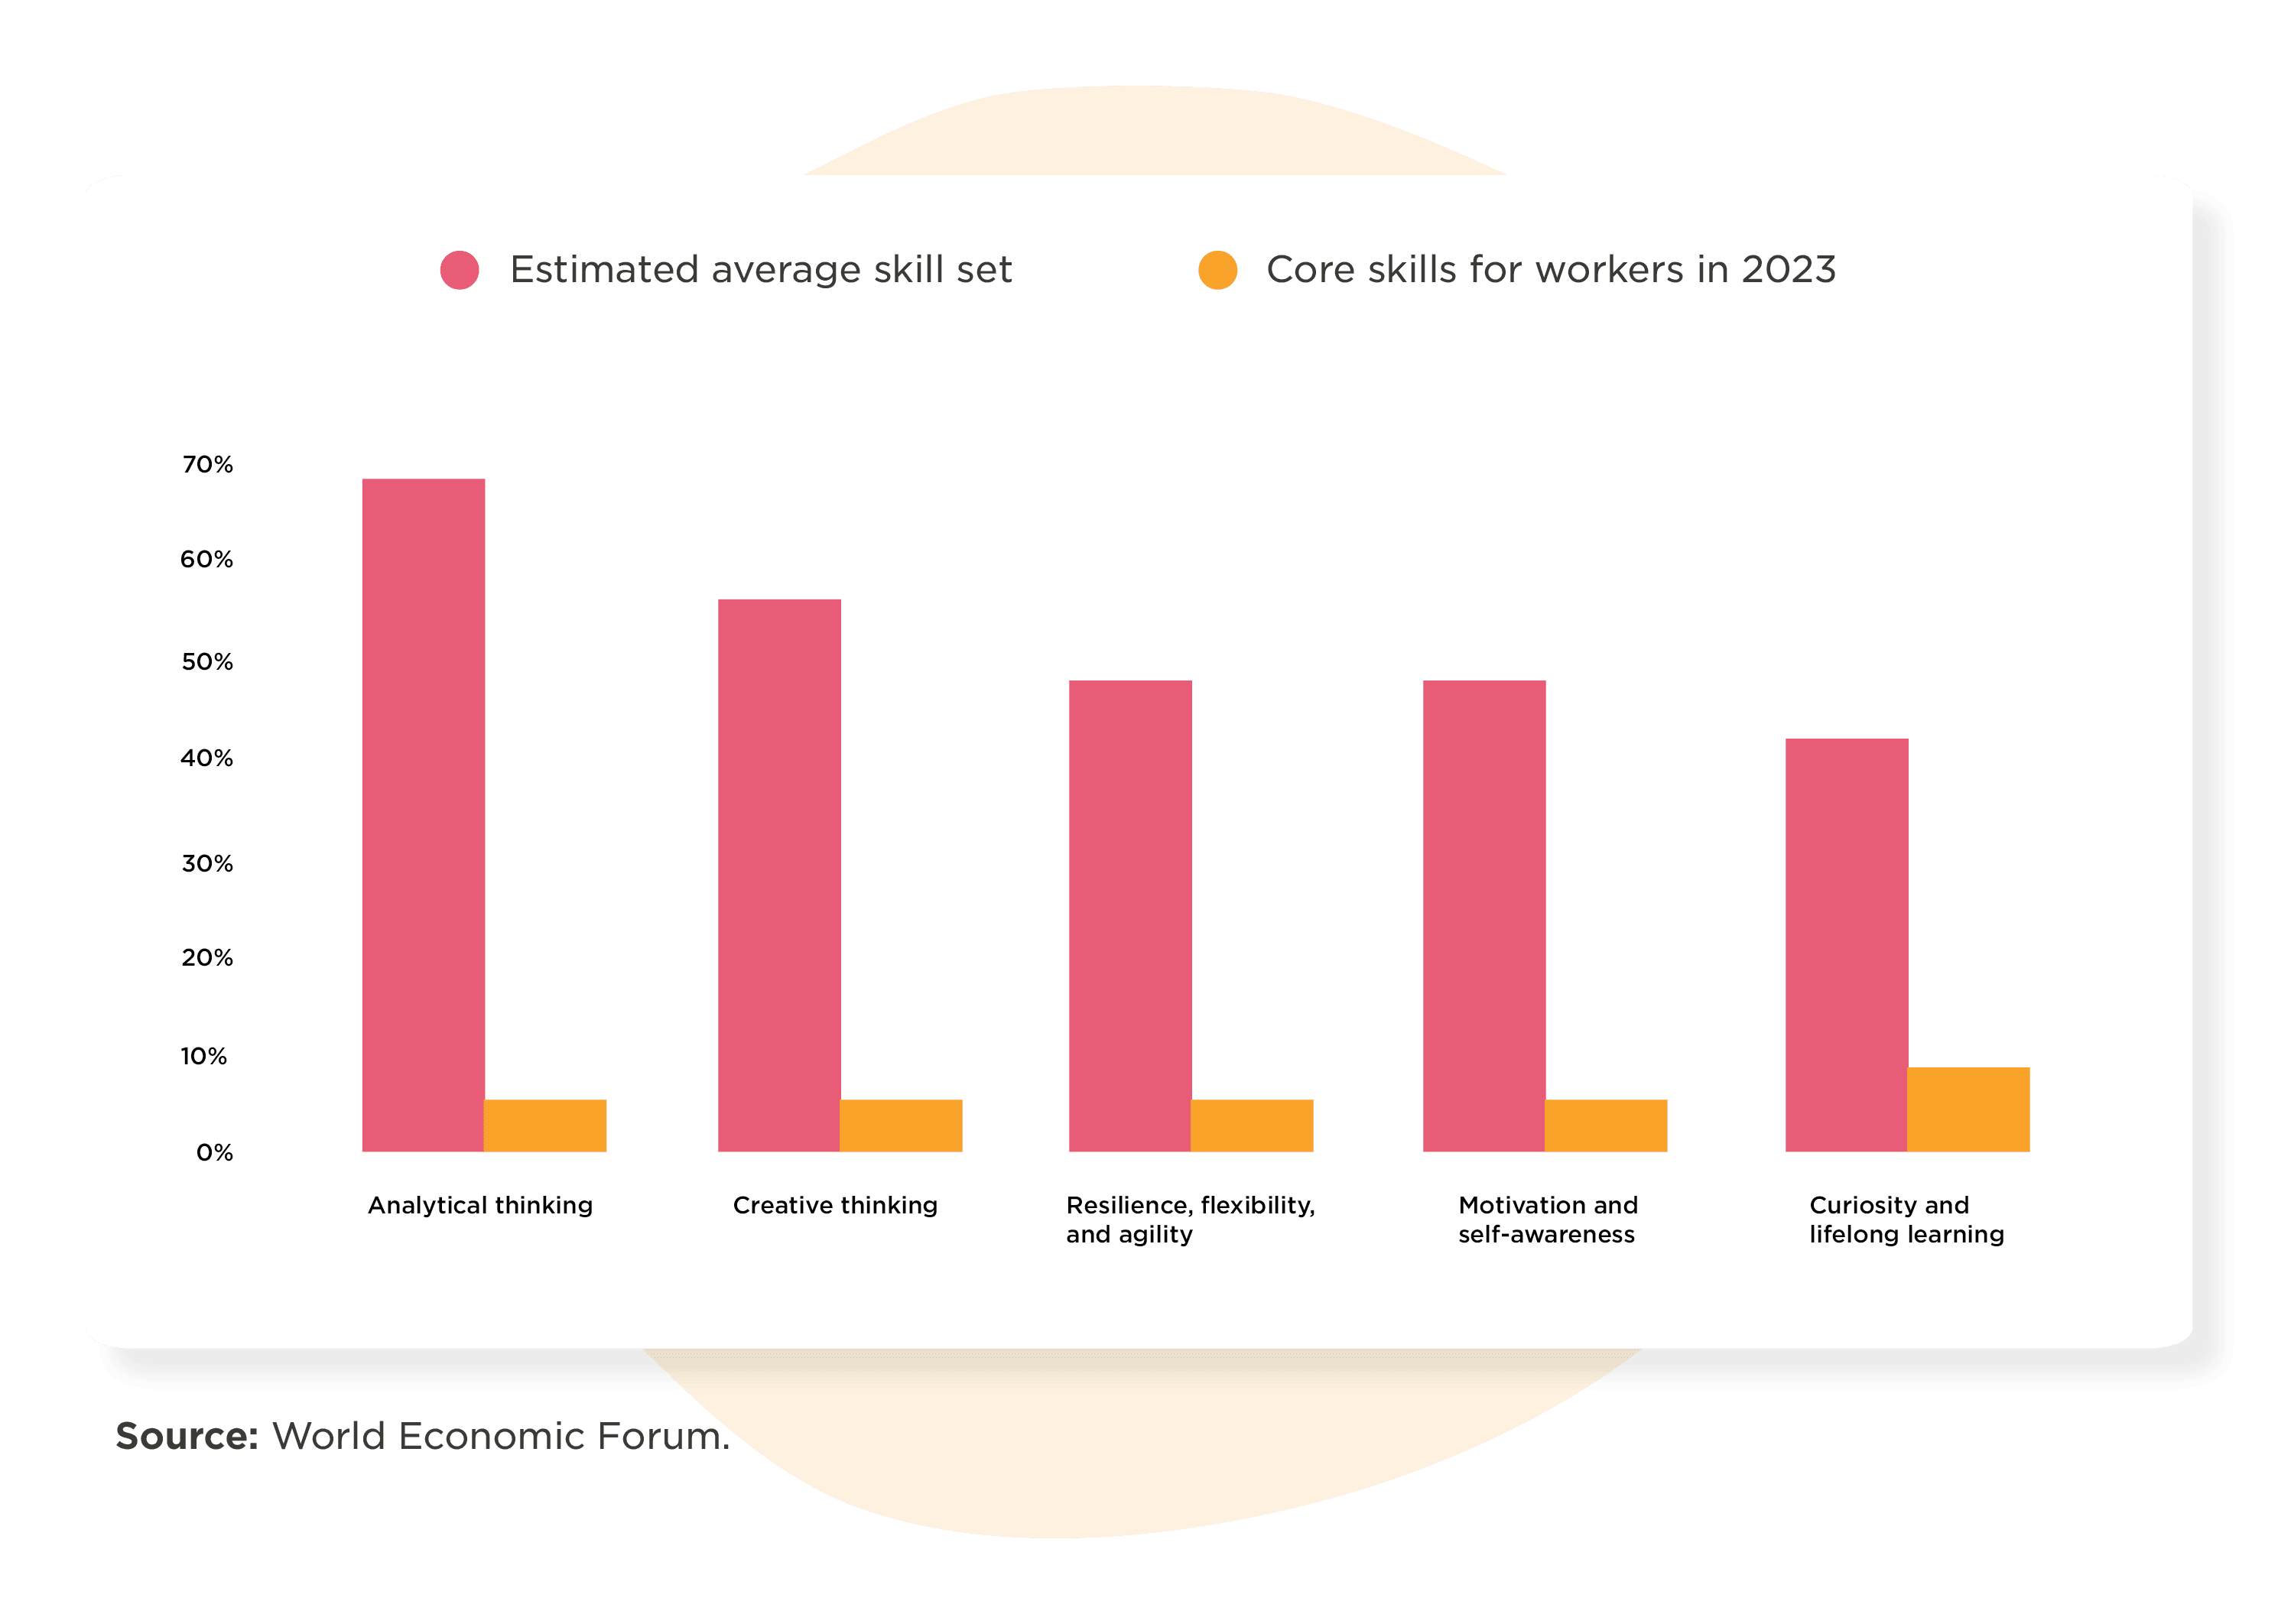
Most executives (72 percent) in the 2021 Deloitte Global Human Capital survey said the ability of people to adapt, reskill, and take on new roles was the most or second most critical factor in helping companies face future disruptions. L&D and upskilling are vital ways to address skills gaps, optimize talents, and attract and retain people.
Deloitte’s 2024 survey reports that executives’ focus has narrowed to filling the skills gap in human capabilities and that 71 percent of them plan to train their workforces in generative AI to scale their people’s capabilities and create more value across their organizations.
Common measurements of training’s ROI include course completion rates, course grades, employee satisfaction surveys, and costs. However, other measurements can more closely relate to training’s impact on business outcomes.
Measure employee productivity before and after training to spot improvement. A team engagement survey can indicate if a leader communicated more effectively after training than before. KPIs for mobility can determine if people got promoted after training, and retention data can indicate if people left.
In general, companies should focus on creating a warm and inclusive company culture. This is not just about providing company perks such as well-stocked kitchens and pool tables. Instead, it’s about creating an environment where people feel they belong and can bring their best selves to work.

Use an HCM to collect and analyze your HR data
Although measuring some KPIs by hand or through spreadsheets is possible, it’s not a sustainable way to maintain a current and accurate view of the company. For this reason, many companies use human capital management (HCM) software to collect and analyze their data.
With an HCM, they can collect data from multiple sources, reducing silos. Advanced analytics are there to help you understand the data clearly so you can make better and more informed decisions quickly.
Examples of people metrics in action: Grow stronger with data on your side
In Deloitte’s 2024 Global Human Capital Trends report, they found that “only about 1 in 3 executives strongly agree that their organization values the work performed by HR,” but that the HR function is critical to “unlocking human performance and potential.”
HR leaders play an increasingly vital role in organizations beyond the people function. In today’s environment, companies rely on HR leaders to help make decisions that directly influence the business’s bottom line.
With this increased responsibility, HR leaders must be more data-driven. That requires pouring through endless sources of data and collaborating with other functions to make sound and agile decisions.
HR teams can use the metrics outlined in this guide to proactively address people’s concerns before they start to affect recruitment, retention, and engagement rates.
In the past, only large organizations could employ such data-driven HR strategies. But modern HR tech is making it easy for companies to analyze, use, and provide the data HR leaders need to lead their companies to success.
The knowledge HR can glean about people impacts entire organizational structures and strategies. With the right HR platform and people analytics, companies can combine these HR metrics with other business data, such as financial statistics and compensation packages, to maximize effectiveness and drive long-term success.