Ask any doctor, and they’ll tell you that a growing child is a healthy child. The same can be said for companies. A company that is growing, adding new team members, new locations, and expanding into new product lines is a healthy company positioned to succeed.
Is your company growing? When you review your headcount over time, are there more people that are leaving than joining? To answer these questions, you need to measure your company’s growth rate.
Key insights
- Understanding your company’s growth rate helps assess its health and potential for success
- Calculating growth rate involves comparing team size at two different times and expressing the change as a percentage
- A positive growth rate indicates expansion, while a negative rate may highlight retention challenges
- Tracking KPIs like headcount, attrition, and turnover helps align HR strategies with business goals
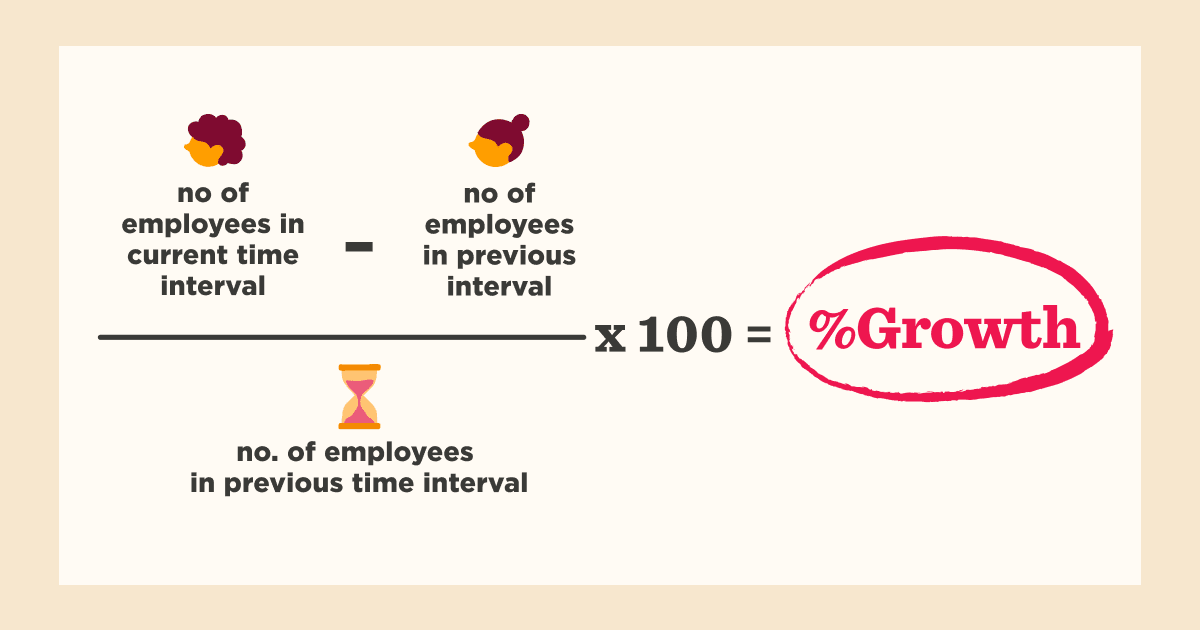
Growth rate formula: How to calculate company growth rate
Growth rate measures how much a company has grown or receded over a specific period of time. A positive number shows a positive growth rate, i.e., that the company is growing. A negative number reveals a negative growth rate, which means that the number of people leaving is greater than the number of new people joining the company.
You can calculate the growth rate in your company by comparing the number of team members at two different points in time and dividing that number by the number of people at the second time interval. The growth rate is usually expressed as a percentage. The formula for calculating growth rate is as follows:

Employee growth rate example
Let’s say you want to measure your company’s growth rate over a specific year. Start by determining how many people were part of your team at the beginning of the year—for this example, let’s say there were 210. Then check how many were on board by the year’s end—let’s say that number grew to 345.
Here’s how you’d calculate the growth rate:
(345 – 210) / (210) x 100% = 64%
This calculation indicates a 64 percent growth rate, meaning your company expanded significantly during that year.
Why should you measure your company’s growth?
Just as other business units within a company have data relating to revenue or sales, HR should have data relating to team members and company growth. This includes HR analytics and KPIs on headcount, attrition, turnover, and terminations.
Having access to easily understandable data provides you with insights about the company, such as the reasons people are leaving and if more people are leaving than are joining.
Using KPIs in Bob helps you to:
- Define any areas that require attention
- Build a strategy to fix the problem
- Revisit the metrics to see if the strategy worked
With Bob, you can seamlessly generate reports on different KPIs and present the hard data to other decision-makers, such as management, the C-Suite, or the Board. This way, you can communicate any potential risk to the company and build a strategy to address it.
Recommended For Further Reading
KPIS for measuring company growth
Using KPIs, you can get an overview of your company over a defined period, or you can slice and dice the data according to different groups such as site, department, gender, age, and tenure, for a more in-depth analysis.
There are four useful KPIs for measuring company growth: headcount, growth, new people, and terminated team members. Let’s take a look at them one by one.
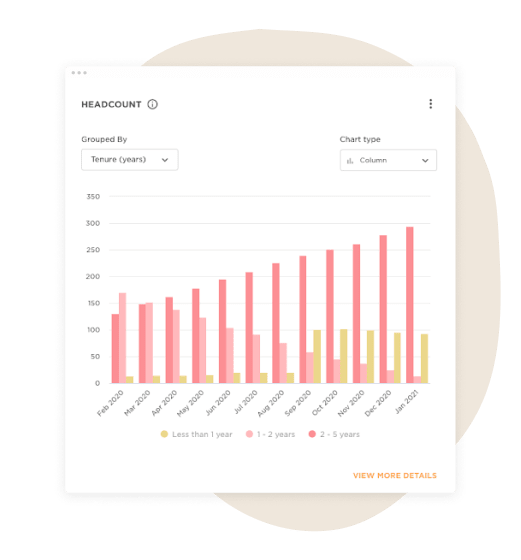
1. Headcount
Headcount refers to the number of people in your company and enables you to see how this number has changed over time. In many HR systems, you can define a date range for the data and the view (monthly, quarterly, or yearly).
For example, in Bob, you can choose how to group the data. You can select “none” for a picture of the entire company, or you can group by site, department, tenure, age, gender, etc. You can also filter the data by metrics such as nationality or job title. You can also add customized filters to view metrics that are important to your company.
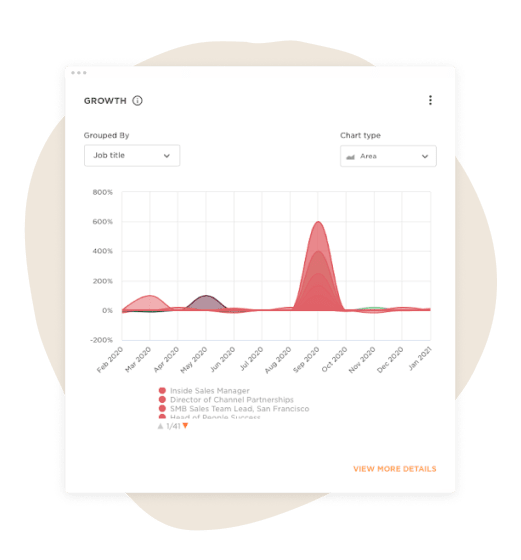
2. Growth
The growth rate is expressed as the difference between two values in time, presented as a percentage of the first value. As with all of the KPIs, you can define the date range, view, and group the data. It’s easy to see at a glance if the growth rate is positive or negative, as compared with the previous month.
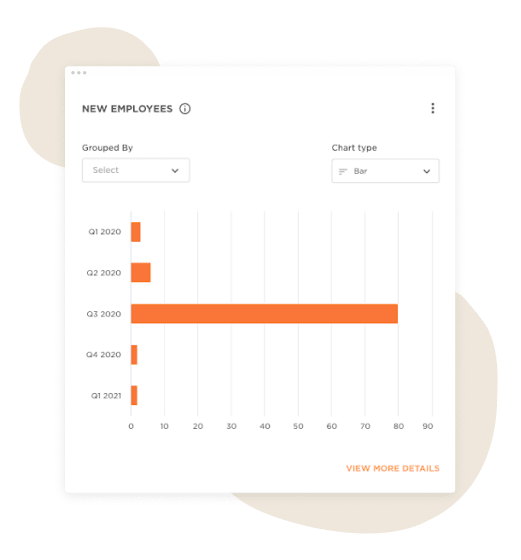
3. New employees
This KPI shows you the new joiners to the company. You can view which months new people joined the company and group them by age, gender, job title, department, and more.
This KPI helps you see which departments and sites grew the most in the past year and can be measured against the company’s expansion plans. You can also evaluate how diverse your hiring has been and whether there was an improvement over the specific time period you’re examining.
4. Terminated people
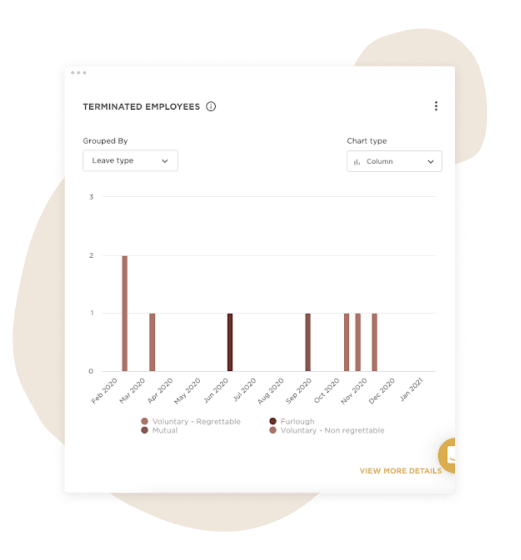
This KPI examines people who have left the company. You can view terminated team members based on the reason they left, or “leave type,” such as mutual, voluntary, involuntary, end of contract, retirement, and furlough.
This KPI provides the data for companies to differentiate between turnover, including all people who left the company (whether they chose to leave or were terminated) and attrition, which refers only to those who voluntarily decided to leave. Noticing a high level of attrition can be a valuable signal, highlighting areas where the organization can improve the employee experience and better support its people.
In Bob, you can view terminated team members by leave reason. You can customize this group based on reasons like compensation, location, and role or according to reasons that are important to your company.
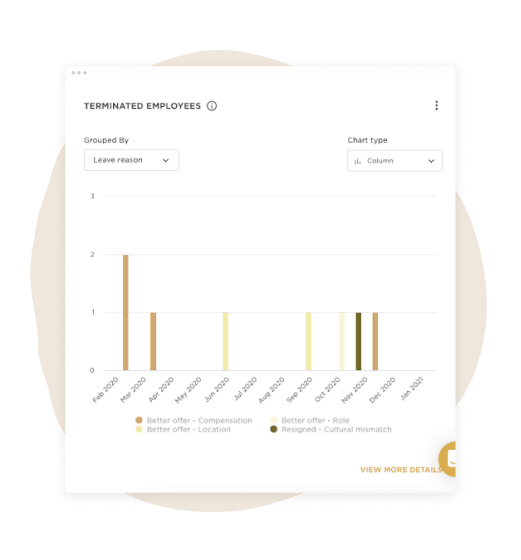
This KPI provides you with essential insights into why people have left the company. If, for example, people are leaving because they’re getting better offers from other companies, it may indicate that your organization is underpaying team members and needs to review compensation packages.
Track company progress with regular growth rate calculations
Monitoring your organization’s growth rate—across headcount, new hires, and departures—gives HR leaders a clear lens into the company’s overall health and direction. Regularly calculating and analyzing these metrics uncovers trends, supports future planning, and strengthens strategic decision-making.
This data empowers teams to spot retention risks, respond to evolving workforce needs, and nurture a more engaged, resilient team. With insights like these, it’s easier to align HR strategies with business goals and keep your organization agile in a rapidly changing environment.
Growth rate formula FAQs
What are other growth rate formulas to know?
Growth rates aren’t limited to headcount. There are a variety of growth rate formulas that businesses can use to measure performance across different areas:
- Revenue growth rate: This is one of the most common growth calculations. It measures how much a company’s revenue has increased (or decreased) over a specific period. The formula is simple: Growth rate (%) = ((Current period revenue – previous period revenue) ÷ previous period revenue) × 100.
- Profit growth rate: This metric measures the change in a company’s profitability over time. It’s calculated similarly to revenue growth but focuses on profits instead of total revenue.
- Customer growth rate: For companies focused on customer acquisition, this formula measures the percentage increase in their customer base over a set timeframe.
- Market growth rate: This calculation determines the growth of a particular market or industry. It’s especially useful for businesses looking to assess their market share or understand broader industry trends.
What is the difference between revenue growth rate and employee growth rate?
Employee growth rate tracks changes in the number of people working for your company—a vital HR metric that highlights hiring trends and workforce expansion. Revenue growth rate, in contrast, reflects the amount of income the company generates over time. It offers insight into sales performance and overall financial health.
Analyzing them side by side can reveal deeper business dynamics. For instance, a high employee growth rate alongside flat revenue growth might suggest opportunities to optimize team structures or streamline operations.
Meanwhile, stronger revenue growth compared to employee growth could highlight an agile, productive team—or signal that additional support may be needed to sustain momentum. Viewed together, these indicators help HR and business leaders align talent strategies with growth goals, ensuring teams are supported as the company evolves.
What are the limitations of company growth rate metrics?
Understanding growth rates is helpful, but they don’t tell the full story. One of the most significant factors to consider is the impact of seasonal trends. Many industries experience predictable fluctuations in hiring and revenue. For example, retail businesses often see spikes in hiring during the holiday season, which can temporarily inflate growth rates.
Additionally, growth rates don’t capture the full story. A high employee growth rate might seem like good news on the surface, but if the new hires don’t align with your company’s financial goals or culture, it can create challenges down the line. Similarly, strong revenue growth might be driven by short-term promotions or one-time events that aren’t sustainable.
Context is key. When interpreting growth rates, it’s important to factor in external conditions like economic trends, industry benchmarks, and internal strategies. This broader view will help you avoid relying too heavily on numbers alone.
What is a normal growth rate for a company?
There’s no one-size-fits-all answer to what constitutes a “normal” growth rate. It depends on factors like your industry, company size, age, and the economic environment. For instance, startups often experience rapid growth in their early years, while more established companies may grow at a steadier, more sustainable pace.
Industry benchmarks can also vary widely, with some industries regularly seeing higher growth rates. The state of the economy is another consideration—during economic downturns, growth rates may slow across the board.