A DE&I dashboard is an interface that provides a visual representation of company diversity, equity, and inclusion practices and outcomes.
The dashboard reflects the company’s DE&I status by representing the data through graphs, charts, and other visuals that can be read at a glance. A DE&I dashboard reflects the status of the workforce in areas such as:
- Gender
- Religious beliefs
- Neurodiversity
- Age
- National origin
- Soft skills
Why do you need a DE&I dashboard?
Rather than sifting through spreadsheets, metrics, and surveys, HR leaders can use a dashboard to provide a simple visual representation of the data. Clear and clutterless data depiction can show information in a way that persuasively tells a story to the target audience. A dashboard also enables leaders to monitor aspects of DE&I which they deem particularly important to company success. As a tracking tool, the DE&I dashboard can assist HR leaders in treating employees equally and building a diverse workforce through recruiting, hiring, and retention practices.
Key insights
- A DE&I dashboard is a visual tool that represents a company’s diversity, equity, and inclusion data through easy-to-read graphs and charts
- It simplifies complex data into a clear narrative, helping HR leaders track progress and identify areas for improvement in DE&I initiatives
- Effective use of a DE&I dashboard supports fair treatment, diverse recruiting, and strong retention practices
- Essential metrics such as representation, turnover rates, pay equity, and career development can be monitored with a DE&I dashboard
- Regular updates and transparent access to this data can drive meaningful DE&I improvements and contribute to a positive organizational culture
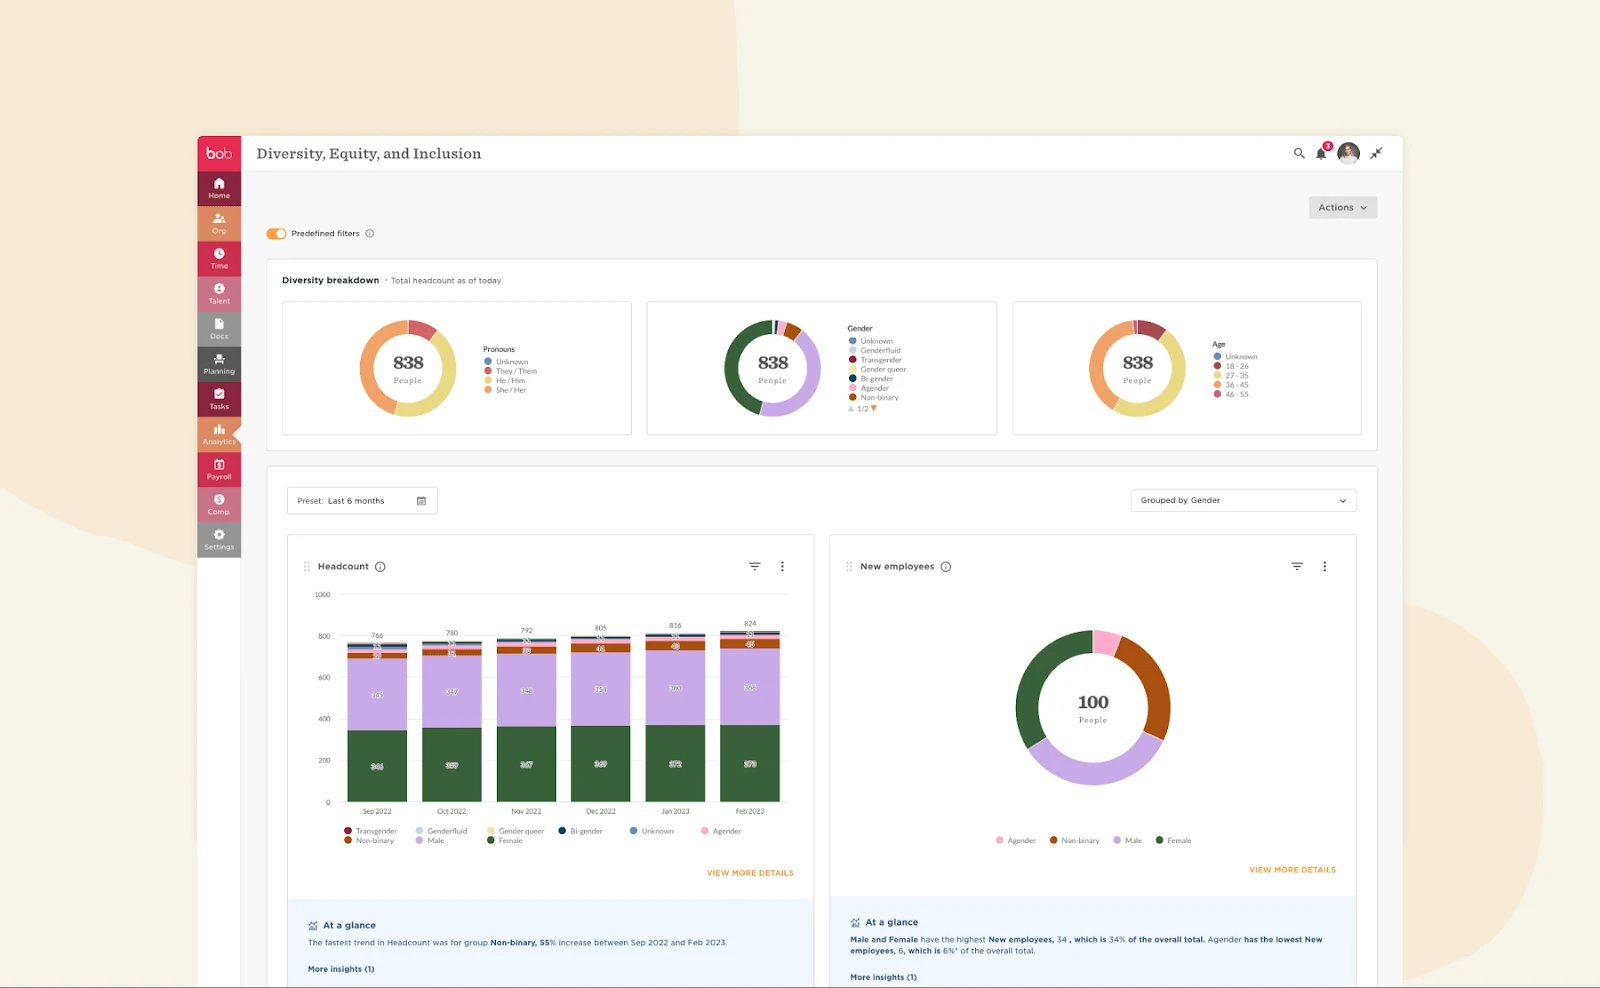
DE&I dashboard examples
Like people, diversity and inclusion dashboards come in all shapes and sizes. Whatever it looks like, a dashboard should offer clear data at a glance. Bob’s DE&I dashboard does just that, so you can create an informed DE&I strategy:
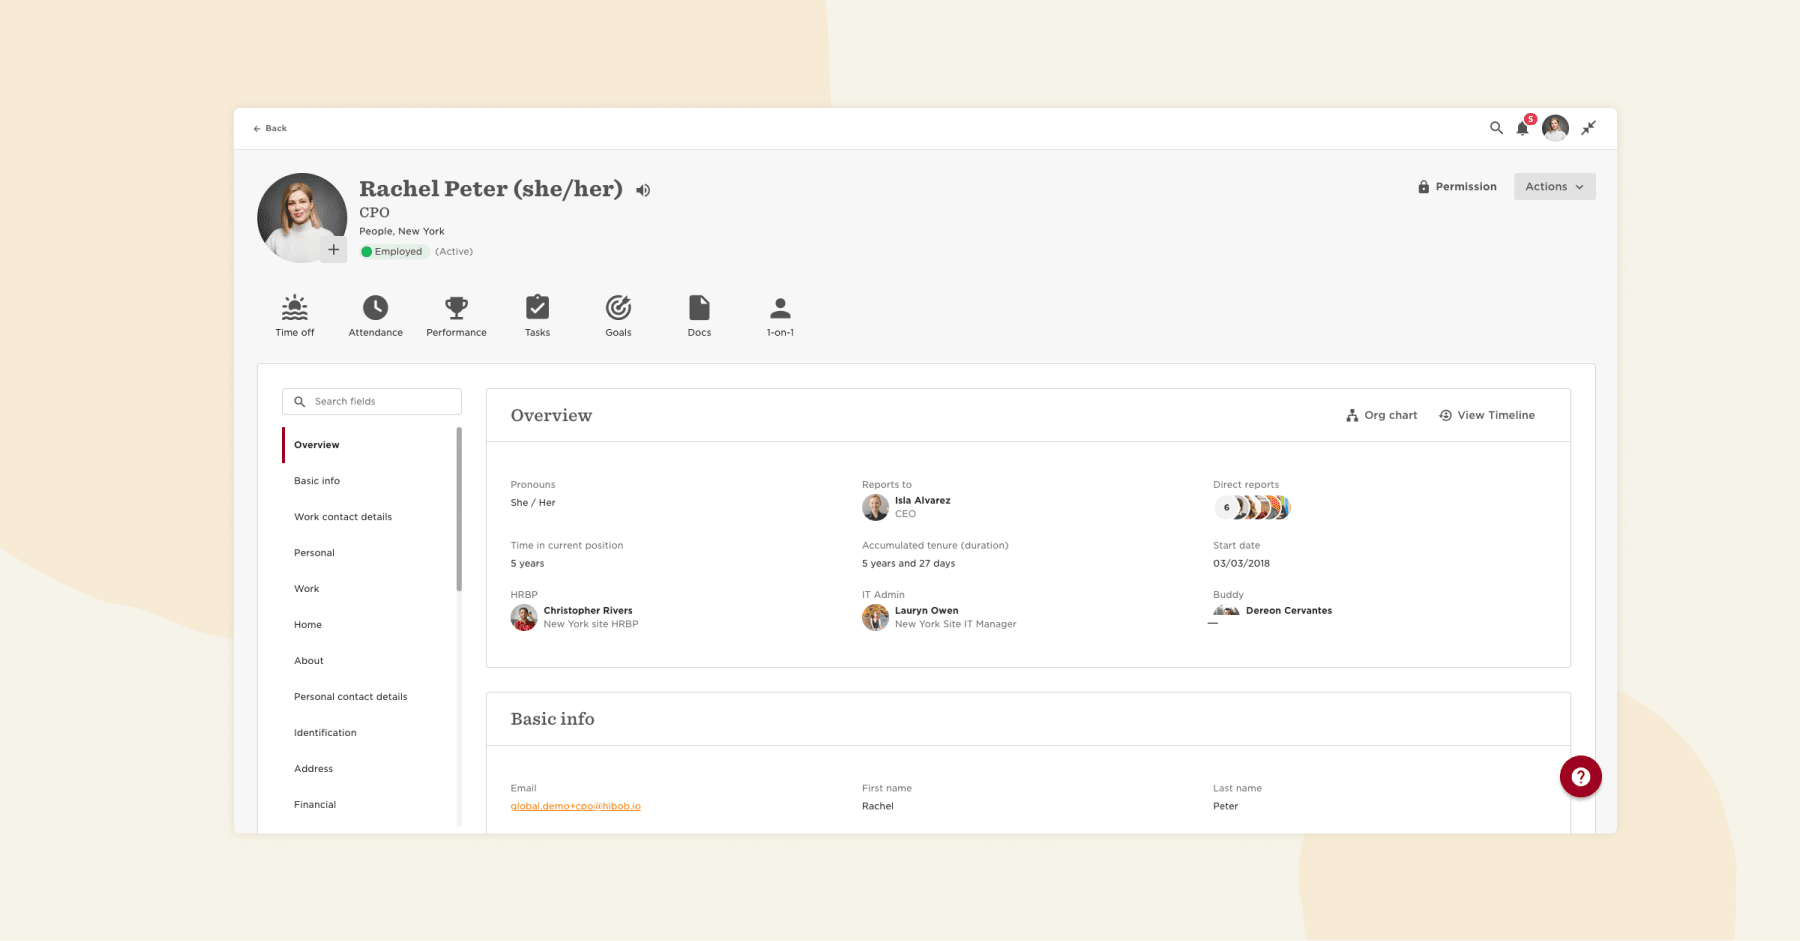
You can also examine data in detail with individual employee profiles:
How to implement a DE&I dashboard
HR leaders can integrate a diversity dashboard that promotes business success by focusing on these practices:
- Design a transparent DE&I policy. Ensure that the basis for the company’s DE&I policy supports the fair and consistent treatment of everyone. Promoting certain individuals over others can reveal discrimination and favoritism. To actively promote DE&I, the company must define what DE&I means and the method for promoting it.
- Adhere to the laws. According to the U.S. Equal Employment Opportunity Commission and the UK’s Equality Act 2010, employers cannot discriminate against employees due to race, religious beliefs, sex, age, disability, or genetic information. Thus, the company must recruit and hire personnel based on their character and competencies rather than these traits.
- Focus on relevant data. To ensure the data in the dashboard will propel business goals, analyze which DE&I metrics are relevant to building a robust culture and boosting engagement and productivity.
- Pay attention to detail. Weeding out duplicates in data and checking for inconsistencies in terminology is critical to maintaining accurate and reliable information in the dashboard.
- Tell a simple story. Tailor the dashboard to directly reflect the data from the Excel spreadsheets so professionals can understand the information at a glance. A clear dashboard provides data visualization that enables the target audience to read the metrics, understand their implications, and make informed decisions based on the evidence.
What metrics to include in your DE&I dashboard
There are a wide variety of metrics that you can include in your DE&I dashboard. Which ones you do include depends on what your company’s priorities are for DE&I.
But, in general, there are some key metrics that are always useful to have:
- Representation – This metric looks at the diversity of your workforce in terms of race, gender, age, sexual orientation, disability status, and forms of diversity.
- Turnover rates – Tracking turnover rates among different demographics can help identify if there are issues with retention and engagement among certain groups.
- Pay equity – This measures any pay gaps among different groups in the workplace.
- Career development – Tracking the percentage of employees who have been promoted, as well as the demographic breakdown of those promotions, can help identify if there are certain groups who experience barriers to career advancement.
- Supplier diversity – This measures how many minority-owned businesses your company uses as suppliers.
DE&I dashboard best practices
To get the most out of your DE&I dashboard, focus on a few key metrics that align with your company’s goals. Otherwise, too much data can be overwhelming.
It’s important to regularly review your dashboard’s metrics to make sure that they’re still relevant and aligned with your company’s priorities.
The data you do focus on is what will enable you to take effective action at improving DE&I in the workplace. It can be the very foundation for positive change. Regularly updating and analyzing the data can give you insights into trends that show where DE&I efforts are needed.
It can also be a good idea to make the diversity metrics dashboard accessible to all employees. This kind of transparency will show that your company is truly committed to improving diversity.
Recommended For Further Reading
How can a DE&I dashboard improve company culture?
Using a DE&I metrics dashboard can help companies monitor their practices to form the company culture they aim to build. The dashboard can help leaders identify areas for improvement while maintaining an intense awareness of DE&I. Practicing this due diligence can assist organizations in building and engaging a diverse workforce, treating employees fairly and transparently, and shaping the culture according to the company’s values.
Track DE&I data with Bob
With Bob, you have DE&I data in an easy-to-use dashboard that’s presented clearly. You can easily assess your DE&I successes and find any gaps or biases.
Bob doesn’t just make you aware of successes and areas for improvement. It allows you to break down metrics by age, gender, ethnicity, and more—so you can uncover the root of a problem and take effective action.
The dashboard is customizable too—you can choose how you want to group the data and track your progress over time.
You’ll even receive alerts to take action on any compensation, bonus, and equity allocation gaps. That way you won’t just be tracking data, but taking practical steps that bring you closer to a truly diverse and inclusive workplace.