
HR reports are essential tools for tracking the health of your workforce and the impact of your HR strategies. As the Human Resource Consulting Group notes, “HR reports give leaders the data they need to link people strategies to business results.”
But while HR leaders are making real efforts to create better, more productive environments, how can they be sure that their words and actions are being matched by results?
That’s where HR report templates come in. They’re a quick and effective way of quantifying your efforts and making sure there aren’t gaps in your recruitment or retention strategies.
We’re going to break down the main human resource report samples that you need to improve your operation, and lay the foundations for a happier, healthier, more effective workplace.
<<Download our free HR report templates and keep track of your most important metrics.>>
Key insights
- HR report templates streamline report creation and ensure consistency, helping you track workforce health and align HR strategies with business outcomes
- Customize these templates for various report types, including quarterly, annual, audit, and board reports, to fit your organization’s needs
What are HR reports?
An HR report is a way of capturing key data, facts, and insights about elements of your business, in order to track and analyze the work you’re doing.
Typically, they can help you find ways of improving your team’s performance, refining your recruitment practices, or making targeted strategic plans for the future. An effective HR report can help you identify trends within your organization, pick out any inefficiencies, and inform better decisions.
Most businesses these days take advantage of advanced HR tech to generate their reports for them, saving hours of effort scraping and compiling the data manually. Human resource information system (HRIS) reports can also generate live dashboards that make it easy to see the most important data at a single glance, helping HR leaders skip straight to the insights that matter.
Whichever way you go about it, our examples of HR reports will give you a good grounding in the main areas to consider.
HR reporting templates
Different HR reports serve different purposes. Some help you spot short-term changes and progress, while others give you a big-picture view of your workforce over the year. Having a mix of report types in your toolbox ensures you always have the best insights you need to make smart, timely decisions.
1. Quarterly HR report
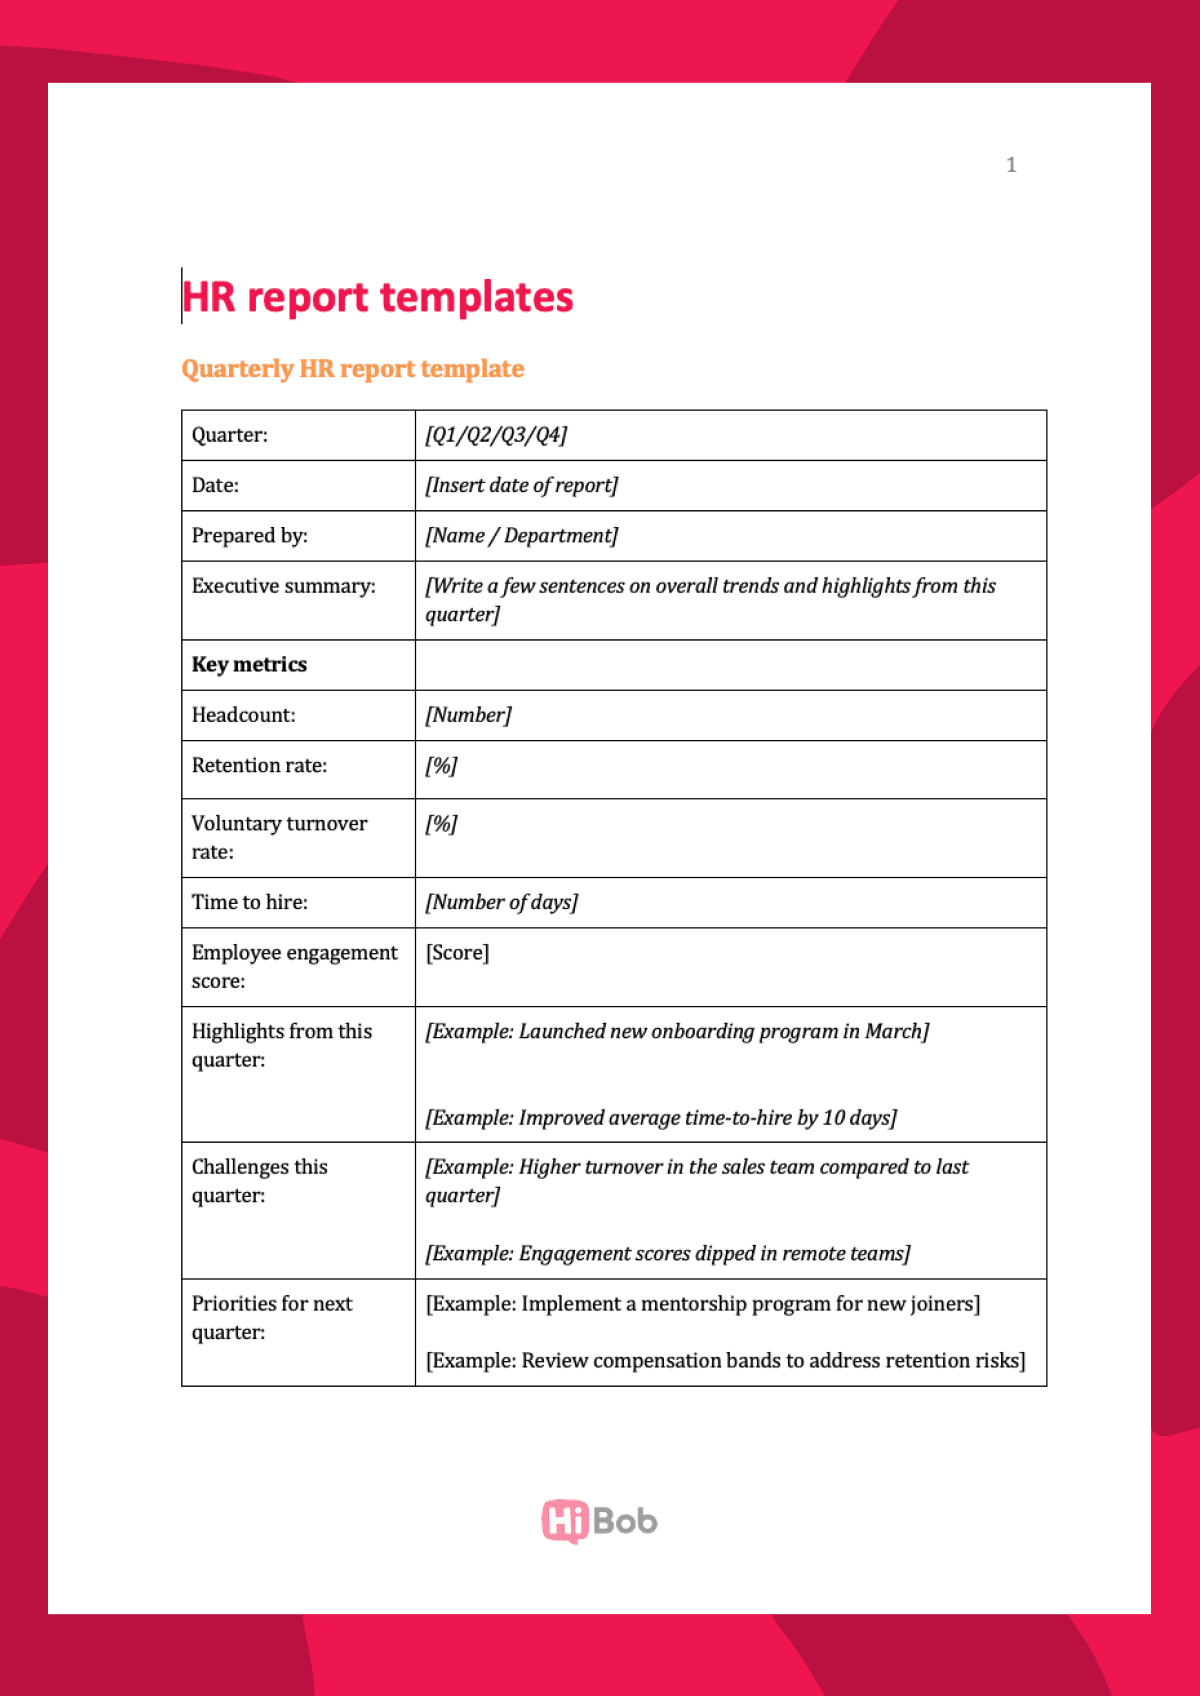
A quarterly HR report gives leadership a clear, short-term snapshot of workforce performance every three months. It’s a chance to review progress on retention, recruitment, and engagement, spot patterns early, and take action before the next quarter begins. This report is great for keeping leadership and department heads aligned on priorities.
Sample quarterly HR report template
| Quarter: | [Q1/Q2/Q3/Q4] |
| Date: | [Insert date of report] |
| Prepared by: | [Name / Department] |
| Executive summary: | [Write a few sentences on overall trends and highlights from this quarter] |
| Key metrics | |
| Headcount: | [Number] |
| Retention rate: | [%] |
| Voluntary turnover rate: | [%] |
| Time to hire: | [Number of days] |
| Employee engagement score: | [Score] |
| Highlights from this quarter: | [Example: Launched new onboarding program in March] [Example: Improved average time-to-hire by 10 days] |
| Challenges this quarter: | [Example: Higher turnover in the sales team compared to last quarter]
[Example: Engagement scores dipped in remote teams] |
| Priorities for next quarter: | [Example: Implement a mentorship program for new joiners]
[Example: Review compensation bands to address retention risks] |
2. Annual HR report
An annual HR report provides a comprehensive view of your workforce over the past 12 months. It’s an opportunity to evaluate progress toward long-term goals, assess the impact of HR initiatives, and set priorities for the year ahead. This report works well for presenting to leadership or the board, as it summarizes key trends and outcomes across the entire organization.
Sample annual HR report template
| Annual HR Report | |
| Date: | [Insert date of report] |
| Prepared by: | [Name / Department] |
| Executive summary: | [Write a few sentences summarizing major achievements, challenges, and trends from the year] |
| Key metrics | |
| Starting headcount: | [Number] |
| Ending headcount: | [Number] |
| Overall retention rate: | [%] |
| Voluntary turnover rate: | [%] |
| Average time to hire: | [Number of days] |
| Employee engagement score: | [Annual average score] |
| Major achievements: | [Example: Reduced turnover in customer service by 15%]
[Example: Implemented company-wide DE&I training program] |
| Key challenges: | [Example: Skills gap identified in mid-level engineering roles]
[Example: Decline in engagement scores among hybrid teams] |
| Priorities for next year: | [Example: Expand leadership development programs]
[Example: Introduce new benefits to improve retention] |
3. HR audit report
An HR audit report is a structured review of policies, processes, and people data. Think of it as running a health scan for your HR function to answer questions like: Are your policies up to date? Is your payroll error-free? Are managers completing performance reviews on time?
By pulling all this into one place, you can spot compliance gaps before they become legal issues, flag outdated processes that slow teams down, and uncover areas where team members aren’t getting the support they need.
Sample HR audit report template
| HR audit report | |
| Date: | [Insert date of report] |
| Prepared by: | [Name / Department] |
| Scope: | [Write what you’re auditing. Examples include: 1. Compliance (labor laws, tax regulations, diversity & inclusion) 2. HR policies and documentation 3. Recruitment and onboarding 4. Performance management 5. Compensation and benefits 6. Training and development 7. HR technology and data security] |
| Key audit metrics | |
| Turnover rate: | [%] |
| Retention rate: | [%] |
| Time to hire: | [Number of days] |
| Completion of annual reviews: | [% completed on time] |
| Training participation: | [% of people completing required programs] |
| Policy compliance: | [Number of gaps or outdated policies identified] |
| Payroll accuracy rate: | [% error-free payroll runs] |
| Diversity metrics: | [Gender, ethnicity, age distribution, etc.] |
| Findings | |
| Strengths: | [Example: 98% of annual reviews completed within deadline]
[Example: Zero payroll compliance issues in the last two quarters] |
| Areas for Improvement: | [Example: Inconsistent onboarding checklist use across regions]
[Example: Missing policy updates for hybrid work arrangements] |
| Action plan: | [Example: Revise and distribute updated guidelines hybrid work policy]
[Example: Implement a central onboarding checklist] |
<<Download our free audit checklist to evaluate your HR department functions.>>
Recommended For Further Reading
4. HR board report
An HR board report is a big-picture snapshot for the people making top-level decisions. Instead of diving into every process detail, it focuses on the metrics and narratives that show how your people strategy impacts company performance. This is where you connect HR’s work to how retention is affecting revenue, how recruitment aligns with growth targets, or how engagement scores are tied to productivity.
Sample HR board report template
| HR board report | |
| Date: | [Insert date of report] |
| Prepared by: | [Name / Department] |
| Executive summary: | [Write a brief overview of key wins, risks, and recommendations for the next period] |
| Key metrics | |
| Headcount vs budget | [Ratio of the number of team members to the number planned for in the workforce budget] |
| Retention rate: | [%] |
| Diversity metrics: | [Gender, ethnicity, age distribution, etc.] |
| Engagement score | [%] |
| Average time to hire: | [Number of days] |
| High-performer turnover rate | [%] |
| Trends: | [Write a few sentences going over changes from the last period and potential business impacts] |
| Risks | [Write a few sentences going over risks like emerging talent gaps, skills shortages, or retention challenges] |
| Recommendations: | [Write down high-level actions for board consideration] |
| Action plan: | [Write down the timeline and priorities for the coming period] |
Specialized HR report types and examples
HR touches every part of the business, so it’s no surprise that there are many ways to report on your work. Some reports focus inward and track training progress, talent development, or skills gaps. Others look outward at hiring trends or workforce performance.
The insights you generate will help you make smarter business decisions when it comes to managing your current teams, and when you look at the future of your company. Let’s look at recruitment, retention, and diversity, equity, and more with templates you can use right away.
1. HR incident report
Typical frequency: As needed, following an incident report or complaint.
Purpose: Creates an accurate, factual record of a single workplace incident that violates individual or cultural safety, such as harassment, discrimination, theft, or safety concerns. Used as the foundation for any follow-up investigations or corrective action.
Main KPIs:
- Date and time of incident
- Location of incident
- People directly involved and witnesses
- Type of incident (safety, conduct, policy violation)
- Immediate action taken
What to include in the report:
- Contact details for the reporter and all involved parties
- Clear, chronological description of what happened
- Any evidence available
- Names and statements of witnesses
- Actions taken in the moment
- Signatures from the reporter and reviewing HR staff
Example findings: An HR incident report might document that a team member slipped on a wet floor in the warehouse, received minor medical attention, and returned to work the same day. The report could also note that signage was missing in that area, and a wet floor sign was placed immediately.
2. HR investigation report
Typical frequency: As soon as an investigation is complete.
Purpose: Summarizes the process, evidence, and conclusions from looking into a specific incident or complaint. Ensures a transparent record of how the matter was handled, supporting compliance and fairness.
Main KPIs:
- Date complaint was received
- Date investigation began and ended
- Investigator(s) assigned
- Number of witness interviews conducted
- Evidence collected
- Whether the outcome is substantiated, unsubstantiated, or inconclusive
What to include in the report:
- Summary of the original complaint or allegation
- Scope of the investigation
- Evidence gathered (documents, digital files, interview notes)
- Timeline of investigative steps taken
- Findings and reasoning
- Recommended or implemented actions (disciplinary action, training, policy updates)
- Sign-off from HR leadership or legal counsel
Example findings: An investigation report might confirm that a team member breached company policy by sharing confidential files with an unauthorized third party. As a result, HR issued a formal warning, required confidentiality training for the team, and updated the data security policy.
<<Download our free HR investigation template and streamline your HR investigations .>>
3. Headcount report
Typical frequency: Monthly or quarterly
Purpose: Tracks the total number of people in your organization or in specific teams/locations at a given point in time. Helps you monitor growth, attrition, and alignment with staffing budgets.
Main KPIs:
- Total active headcount
- New joiners during the period
- Departures during the period
- Headcount by department, location, or role
- Headcount vs. budgeted positions
What to include in the report:
- Current headcount figures and breakdowns
- Net headcount change since last report
- Details of new joiners and departures
- Open positions and expected start dates for pending hires
- Commentary on notable increases/decreases and reasons
Example findings: A headcount report might show that your marketing team is operating at 80% capacity due to two recent resignations, with one replacement already confirmed to start next month.
<<Download our free HR audit checklist and learn about the health of your HR operations .>>
4. People performance report
Typical frequency: Annual, or via a live dashboard
Purpose: Gives you a clear overview of how effective your teams are, and whether you’re hitting your productivity targets. Helps you to identify skills gaps and training needs, and support effective succession planning.
Main KPIs:
- Absenteeism rate
- Overtime hours
- Training costs
- Employee productivity
What to include in the report:
- Aggregated performance data across individuals and teams
- Ratings from recent performance appraisals
- Comparison of current vs. previous performance periods
- Skills gaps identified
- Development and training activity records
Example findings: You might discover uneven workloads between individuals or teams, and areas where you’re over- or under-spending on training and development programs. Catching skills gaps or people who need more support with their work will help you keep performance levels high.
5. Recruitment report
Typical frequency: Monthly or quarterly
Purpose: Tracks the efficiency and effectiveness of your hiring efforts. Helps identify bottlenecks, cost drivers, and trends in candidate quality.
Main KPIs:
- Time-to-fill
- Time-to-hire
- Cost per hire
- Quality of hire based on performance scores
- Offer acceptance rate
- Employee growth rate
What to include in the report:
- Number of roles opened, filled, and still vacant
- Candidate pipeline data, like applications, interviews, and offers
- Recruitment source performance, like job boards, referrals, and agencies
- Diversity metrics for applicants and hires
- Notable hiring challenges or wins
Example findings: A recruitment report might show that roles sourced via team member referrals filled 25 percent faster and had higher first-year retention rates than those from external job boards. This could prompt an expansion of the referral program.
6. Diversity and inclusion report
Typical frequency: Quarterly or annually
Purpose: Monitors representation, equity, and inclusivity across the organization. Helps identify disparities, track progress on DEI goals, and guide policy changes.
Main KPIs:
- Gender diversity ratio
- Pay gap by gender, ethnicity, or other demographics
- Representation by demographics in leadership roles
- Promotion rates by demographic
- Salary range penetration
- Salary average
What to include in the report:
- Workforce demographic breakdowns by department
- Pay equity analysis with supporting charts or tables
- Hiring, promotion, and turnover rates segmented by demographic
- Summary of DEI initiatives and progress since last report
- Areas identified for improvement
Example findings: A DEI report might reveal that women represent 40% of the total workforce but only 15% of leadership roles. This could lead to targeted development programs to prepare more women for management positions.
7. Training and development report
Typical frequency: Quarterly or annually
Purpose: Track learning initiatives, skills development, and training ROI to ensure people have the tools and knowledge to excel in their roles.
Main KPIs:
- Number of training sessions completed
- Training completion rate per person or team
- Average training hours per person
- Training cost per person
- Post-training performance improvement
What to include in the report:
- List of training programs completed during the period
- Participation rates and completion statistics
- Skills assessments before and after training
- Feedback from participants on program quality
- Any certifications earned
Example findings: A training report might show that technical skills workshops increased productivity in the product engineering team by 10 percent, but soft skills courses had lower engagement. This might prompt a need for more relevant content.
8. Talent management report
Typical frequency: Monthly
Purpose: Gives HR leaders a clear overview of the expertise and talent that lies within the company. Includes basic information and figures that help you keep track of your people, but will reveal insights such as cost per hire, time-to-fill, and satisfaction survey scores.
Main KPIs:
- Turnover
- Cost per hire
- Time-to-fill
- Satisfaction scores (or employee net promoter score (eNPS))
- Performance ratings
- Total staff number
- Total monthly salary outgoings
- Vacancies
- Average length of service
- Average training costs
What to include in the report:
- Headcount and vacancy overview
- Turnover trends with reasons for departures
- Talent pipeline health for internal and external candidates
- Performance and engagement summaries
- Skills inventory and future hiring needs
Example findings: Your basic HR dashboard gives you a comprehensive overview of how your people are performing, and whether you’re within budget on recruitment, training, and culture-boosting activities. Segmenting by departments can highlight teams with particular retention issues or a specific factor that is affecting satisfaction or performance levels.
9. Overtime monitoring
Typical frequency: Weekly
Purpose: Gives you a clear idea of your people’s workloads and whether there is a higher volume of work that needs completing.
Main KPIs: Overtime hours segmented by department, job role, age group, or working location
What to include in the report:
- Overtime hours logged per person
- Trends compared to previous weeks/months
- Notes on workload spikes
- Recommendations for redistributing tasks or adding resources
Example findings: Overwork can quickly lead to burnout, which in turn increases your turnover rate—costing your business money due to expensive recruitment and training costs. Keeping a close eye on overtime gives you useful advance warning of any likely issues here.
10. Compensation and benefits report
Typical frequency: Quarterly
Purpose: Analyzes salary structures, benefits, and incentive programs to ensure competitive, fair, and cost-effective compensation strategies. Supports informed budget planning and talent retention efforts for CFOs and HR.
Main KPIs:
- Total salary costs
- Benefit payments
- Overtime payments
- Incentive payments
- Salary comparison between departments
- Pay brackets and length of service
What to include in the report:
- Base salary breakdowns by department and job level
- Benefits usage and enrollment data
- Comparison to industry benchmarks
- Trends in incentive spending
- Recommendations for adjustments to stay competitive
Example findings: Your analysis will inform smarter decisions when it comes to salary negotiations, paid leave, resource allocation, and your policies around incentives, bonuses, and benefits.
11. Absence and leave report
Typical frequency: Monthly or quarterly
Purpose: Tracks team member absences and leave usage to maintain workforce productivity. Tracks compliance with leave policies and identifies potential attendance issues.
Main KPIs:
- Absenteeism rate
- Number of unplanned absences
- Average leave days taken per person
- Leave type distribution
What to include in the report:
- Summary of absences by type and frequency
- Patterns by department, role, or season
- Policy compliance checks
- Notes on potential attendance concerns
Example findings: An absence report might show a spike in unplanned sick leave in a single department. This might lead to a review of working conditions or wellness initiatives.
12. Turnover and retention report
Typical frequency: Quarterly or annually
Purpose: Monitors team member departures and retention rates to pinpoint causes of turnover, measure retention strategies, and improve workforce stability. Also gathers everything you need to build loyalty and trust, and ultimately reduce your recruitment costs.
Main KPIs:
- Turnover rate (voluntary and involuntary)
- Retention rate
- Average length of employment
- Common exit interview themes
- eNPS
- Career path ratio
- Salary change
- Absenteeism
What to include in the report:
- Departures segmented by department, role, and reason for leaving
- Trends compared to previous periods
- Retention metrics for high performers and key roles
- Actions taken to address turnover drivers
Example findings: A turnover report might reveal that most voluntary departures occurred within the first six months of employment. This could suggest that onboarding and early engagement need improvement.
13. Health and safety report
Typical frequency: Monthly or quarterly
Purpose: Tracks workplace safety incidents, hazards, and compliance to maintain a safe environment and reduce risks.
Main KPIs:
- Number of incidents reported
- Incident severity levels
- Days since last incident
- Safety training completion rate
What to include in the report:
- Summary of each incident
- Analysis of root causes
- Corrective actions taken
- Safety inspection results
- Recommendations for prevention
Example findings: A safety report might reveal that most minor injuries occurred in the warehouse due to improper lifting. You could use this data to prompt a refresher training session on safe handling techniques.
<<Download our free HR report templates and keep track of your most important metrics.>>
The importance of HR reporting
With businesses needing to be agile and flexible in their recruitment, regular reporting is a surefire way of keeping your finger on the pulse and understanding exactly what is happening at your company.
An HR platform will filter and sort the results for you, turning it into meaningful data that you can use. When it comes to areas like risk avoidance, succession planning, and resilience testing, up-to-date and accurate information is essential.
HR reporting will reinforce your business in three main ways:
1. Identifying issues and areas for improvement
Effective and comprehensive reporting can help HR leaders look below the surface and pick out trends that affect their teams. If, for example, only a small proportion of your development team understand a key programming language, you’re likely to want to organize appropriate training or reconfigure your succession planning.
Similarly, an above-average turnover rate will reveal issues within the work environment or team dynamics that will warrant further and more thorough investigation. These kinds of insights are much harder to detect without the data to draw them out.
2. Supporting strategic, targeted planning
Whatever field you work in, effective decision-making is always powered by information. Gathering the right insights via your reporting will allow you to make informed choices about the future direction of your HR function and the business as a whole.
3. Predicting risks and boosting communication
The data you glean in your reports can help you forecast what’s around the corner, revealing both risks and opportunities that lie ahead. Compare these with your short and long-term goals, and you’re more likely to make the right choices when it comes to the major calls. Clear, well-packaged reports also ease communication with the rest of senior management, helping you support your case in internal discussions and giving everyone the benefit of cold, hard data.
4. Tracking the performance of your people and supporting their growth
When people are struggling, it’s all too easy for them to keep quiet, whether out of pride, embarrassment, or a simple lack of time and energy. HR reporting makes it easier to identify team members who might benefit from additional support, or whose skills aren’t being utilized to their full potential. This isn’t about breathing down people’s necks, it’s about making sure you’re providing the opportunities for feedback and guidance that any professional needs—after all, happier people perform better and stick around for longer.
Best practices for HR reporting: How to write an impactful HR report
To be sure that your HR reporting is hitting all the right notes, there are a few main practices that are worth following:
1. Choose the right focus & define your purpose
For your findings to be usable, you need to frame them correctly. That means choosing the right frequency for your report, whether that’s weekly, monthly, quarterly, or even annually. It’s also crucial to consider what form you’d like your output to be in. What do you need from the data, and how will you use the report? Answering this question will help keep you focused when building your reporting structure so that it’s as useful as possible.
2. Know your audience
Build your HR report with the reader in mind and think about who will use the information. Senior leadership may want high-level trends like year-over-year turnover rates or diversity ratios, and recommendations such as expanding flexible work policies or increasing training investment in underperforming departments.
Department managers might need detailed breakdowns for their teams to identify which roles have the highest absenteeism or where workloads are uneven. Tailoring your content makes your reports relevant, actionable, and easy to understand for the people making decisions based on it.
3. Use a mix of KPIs
Once your aims are clear, you can build your report structure out with a range of KPIs to measure. Make sure you include a mixture here so that you can easily identify any inconsistencies and make up for gaps that might appear in the data. Choosing the metrics that matter goes a long way to making your report as effective as it can be.
4. Automate as much as you can
Tools such as people analytics software make it much easier to build and generate reports. By automating the data collection process, you’ll save your team hours in manual processing time, which can instead be used to analyze the results and build strategies to improve your work. Automation will also gather all your results and reports together in one place, through live dashboards that make it easy to see what’s important.
5. Use HR report templates
As your company grows, so does the number of HR reports you’ll have to write. Templates provide a nice structure for organizing your data and keeping reports clear and comparable over time. They also help standardize formatting across your organization so stakeholders always know where to look for the information they need.
<<Download our free HR report templates for impactful HR reporting.>>
6. Tell a story with data visualizations
Visualizing data turns numbers into a narrative your audience can understand at a glance. Use charts, graphs, and heat maps to highlight the trends or changes that matter most. For example, a line chart showing month-by-month new hire attrition can reveal exactly when onboarding improvements started paying off. A heat map of overtime hours by department can instantly pinpoint where workloads are uneven. Framing your visuals in a way that connects the data to a real business challenge or win helps your stakeholders see what’s happening and why it matters.
7. Take it forward
Carrying out your HR reporting is only a means to an end, so it’s important that you build structures and processes for taking your findings and adjusting or creating future strategies. Think about how you’ll store historical data for comparison, or to benchmark your performance before and after you make a significant change. Analyze your results, draw your conclusions, and take the actions you need to improve your business’s performance.
<<Download our free HR report templates and keep track of your most important metrics.>>
Perfect your HR reporting with a free HR report template
A clear, consistent HR report empowers you to share meaningful insights, highlight wins, and back every recommendation with data. This means you can track progress on your key people goals, celebrate achievements, and spot opportunities to improve before challenges arise.
With a well-thought-out HR report template, you’ll spend less time formatting and more time turning workforce data into strategies that move the needle forward for your business.
<<Download our free HR report templates and track your most important metrics.>>
Meet Bob
At HiBob, we’ve built a modern HR platform designed for modern business needs—today and beyond.
We focused on building something that is robust yet intuitive and easy-to-use, which has led Bob to be the platform of choice for thousands of fast-growing, modern, mid-sized organizations.
For HR, it delivers automation of many common processes, allows greater oversight and visibility of the business, and centralizes all people data in a secure, user-friendly environment.
For managers, it provides access to data and insights to help them lead more effectively and streamline processes.
For employees, it’s the tools and information they need to connect, develop, and grow throughout their journey.
In a short time, Bob can be deployed to enable communication, collaboration, and connectivity that drives stronger engagement, productivity, and business outcomes.