Capital efficiency measures how effectively a company uses its financial resources to generate revenue, crucial for sustainable growth.
What is capital efficiency?
Capital efficiency broadly refers to how effectively a company spends its money to operate and grow. More specifically, it measures how much money is invested in the business versus how much revenue is generated from that investment.
<<Download the SaaS metrics cheat sheet.>>

There are multiple capital efficiency metrics you can track depending on your business model and stage of growth. Some of the most common include:
- Cash conversion score
- Burn multiple
- Return on capital employed (ROCE)
- Hype ratio
- Bessemer’s efficiency score
For SaaS companies in particular, capital efficiency plays a central role in balancing growth strategies with financial discipline.
Growth has always been the name of the game for VC-backed SaaS businesses. When venture funding is plentiful, a growth-at-all-costs strategy can feel justified. But more often than not, efficiency needs to counterbalance aggressive growth.
This guide walks through the basics of capital efficiency, how to calculate key metrics like cash conversion score, and why these measures are so important for SaaS startups and scaleups.
What is a cash conversion score?
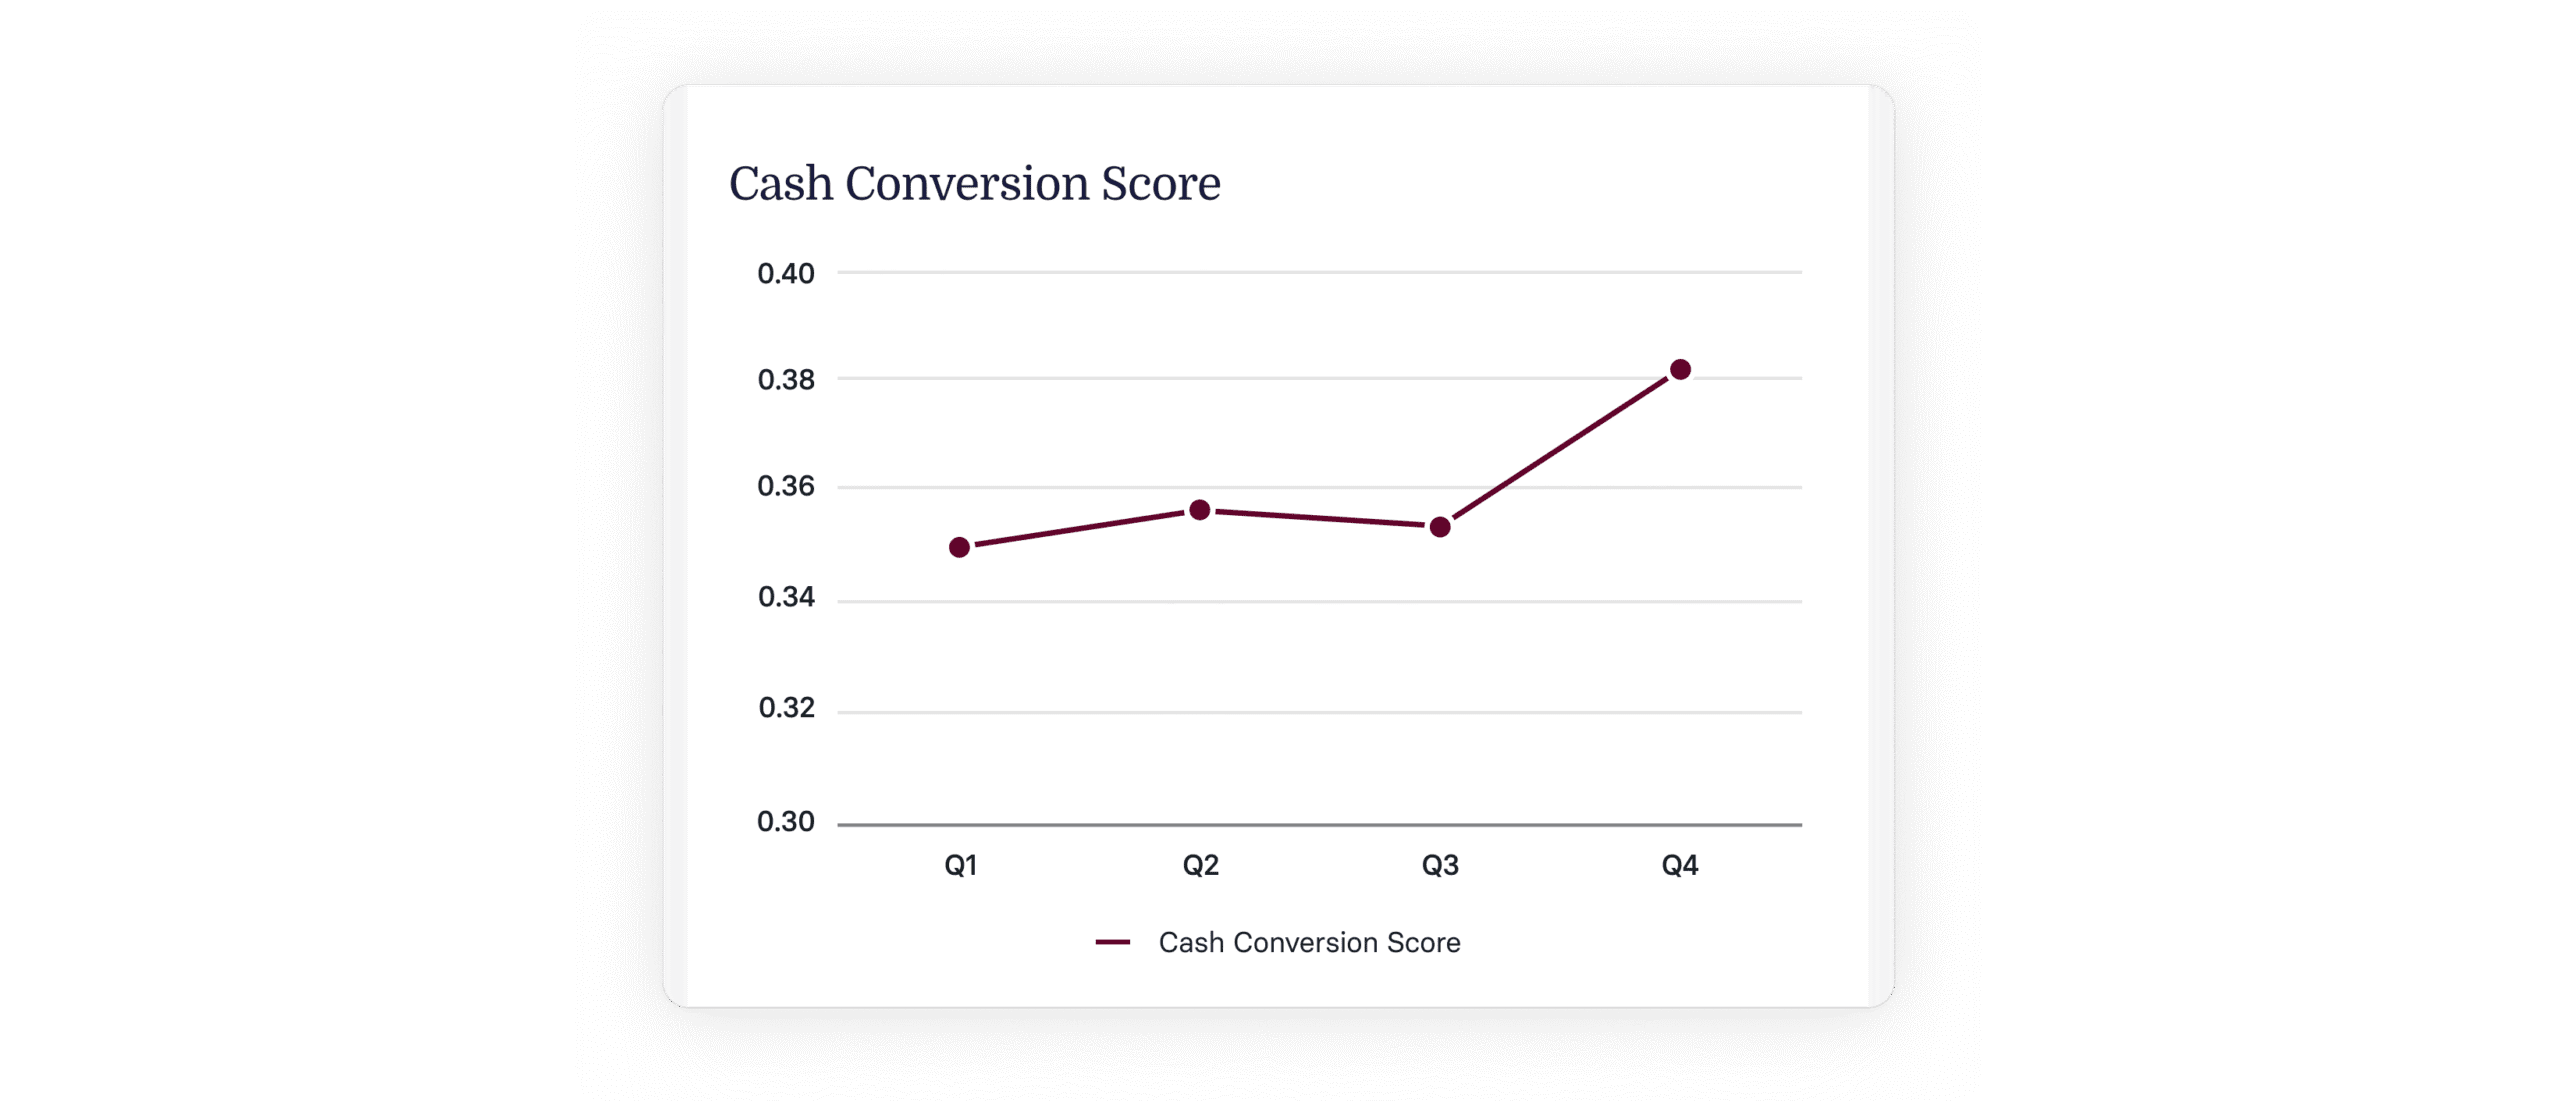
Cash conversion score is a critical capital efficiency metric for SaaS companies. It measures the current return on investment (ROI) of dollars put into the business.
By looking at current ARR, total raised capital, equity, debt, and cash, cash conversion score provides insight into top-line recurring revenue as a proxy for ROI.
When combined with additional metrics, it offers a deeper view of product–market fit and the scalability of sales and marketing teams.
When combined with additional metrics, it offers a deeper view of product–market fit and the scalability of sales and marketing teams.
<<Gain insight into your future cash flow with this bookings to cash waterfall template.>>
Cash conversion score vs. capital efficiency formulas
Capital efficiency is an umbrella term that relies on several different metrics to provide context. Each one illustrates how much revenue is generated per dollar raised or invested.
To get the most forward-looking view, finance teams need to understand not only how to calculate each metric, but also how to apply them strategically.
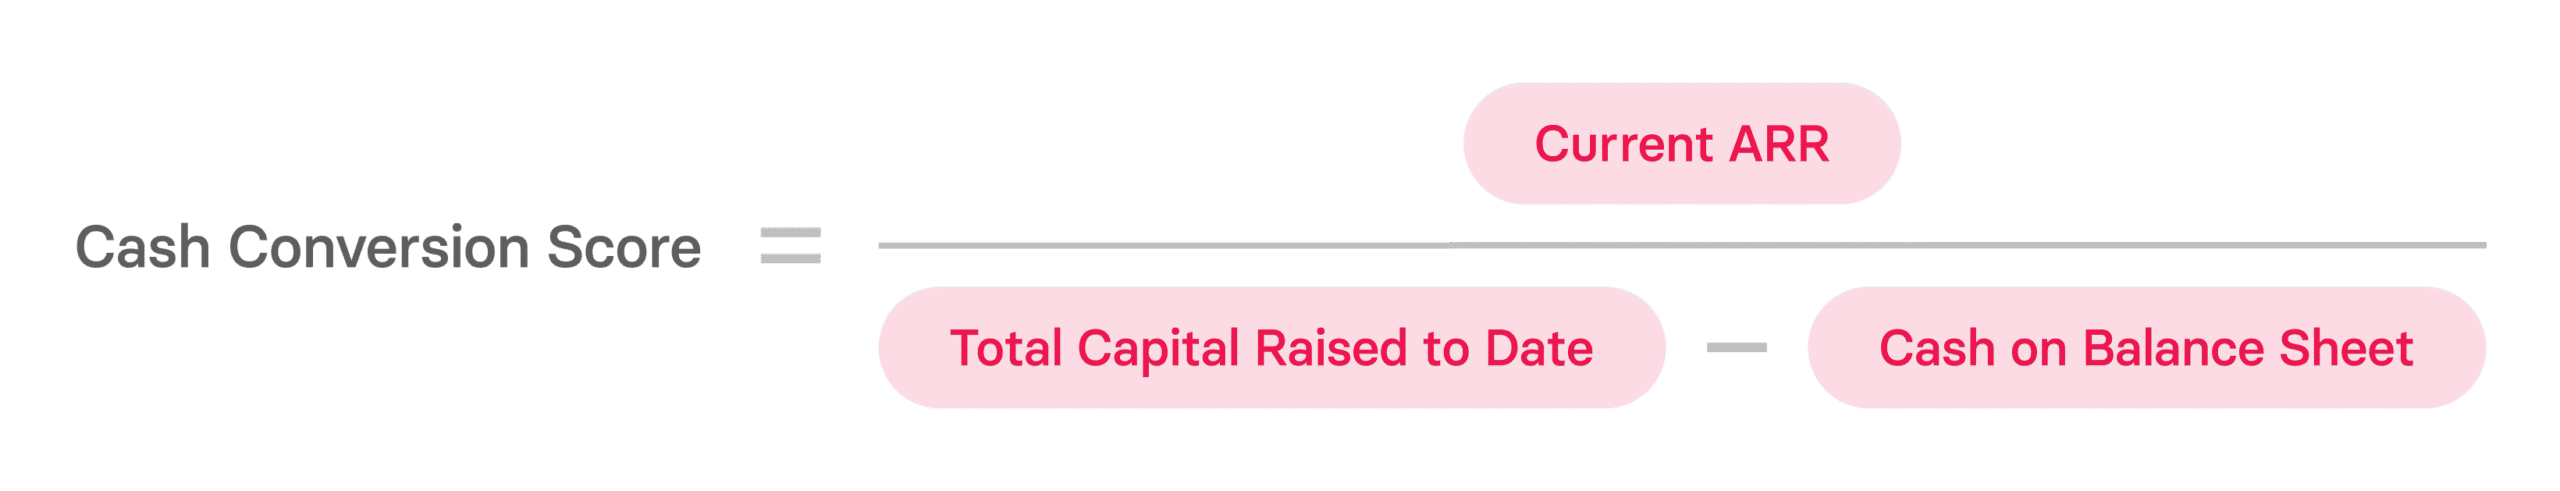
Cash conversion score
To calculate your cash conversion score, take your current ARR and divide it by the difference between total capital raised to date and your net of current cash (your equity and debt minus cash from your balance sheet).
Bessemer Venture Partners developed this formula and associated benchmarks to evaluate the future success of SaaS companies. Scores typically fall between 0.25x and 1.0x+, with the following categories:
- Good: 0.25x–0.5x (approximate IRR of 40 percent)
- Better: 0.5x–1.0x (approximate IRR of 80 percent)
- Best: 1.0x or higher (approximate IRR of 120 percent)
While ROI itself isn’t directly determined by cash conversion score, the metric highlights multi-year trends such as product–market fit and the efficiency of scaling sales and marketing efforts.
Burn multiple
The burn multiple, introduced by David Sacks of Craft Ventures, is another widely used measure of capital efficiency—particularly valuable during market downturns.

Unlike LTV/CAC, which focuses on sales and marketing, burn multiple reflects the efficiency of the entire business. Because it can be measured monthly, quarterly, or annually, it’s flexible enough to apply at any growth stage.
- Lower burn multiple = higher efficiency
- Higher burn multiple = weaker efficiency
Return on capital employed (ROCE)
ROCE is a more traditional corporate finance metric, often used interchangeably with “capital efficiency” in the context of public companies.

A high ROCE indicates a greater percentage of the company’s value returned as profit to stakeholders within a given time period.
ROCE is best suited to later-stage or public companies. For younger companies with large unused cash reserves, it may not provide an accurate picture.
To get a more complete view, compare ROCE alongside ratios like return on invested capital, return on assets, and return on equity.
Recommended For Further Reading
Bessemer’s efficiency score
SaaS startups often burn significant capital to fuel growth. To help evaluate efficiency at this stage, Bessemer Venture Partners introduced a simpler formula:

Benchmarks typically follow a good/better/best framework:
- Good: < 0.5x
- Better: 0.5x–1.5x
- Best: > 1.5x
By tracking efficiency over time, you can see whether growth is sustainable—especially during market uncertainty.
Hype Ratio
Developed by Dave Kellogg, the hype ratio measures the relationship between capital raised and ARR. It aims to quantify the “buzz” around a company and how efficiently that capital is being translated into revenue.
Kellogg determined that venture capital, when spent correctly, turns into ARR and hype (primarily customer response, which further increases ARR). So, to find the hype ratio itself, Kellogg divides capital by ARR.

The idea is that when venture capital is spent wisely, it not only drives ARR but also creates excitement among customers, which in turn fuels more revenue growth.
Customer response plays a big role here. Strong referrals and word of mouth should naturally boost efficiency in sales and marketing, helping new ARR come in more cost-effectively.
When looking at benchmarks, context is key:
- 1–3: Healthy balance between capital and ARR
- 3–5: Too much hype compared to ARR
- Above 5: Very little ARR behind the hype
It’s also worth noting that the hype ratio is most relevant pre-IPO. Private companies should be able to raise and burn capital efficiently enough to reach IPO with a ratio near zero.
To use the hype ratio effectively, calculate it monthly or quarterly to check for product–market fit. At the same time, keep an eye on CAC and average sales cycle to see how efficiently customers move through your funnel—and where there’s room to improve.
Why capital efficiency matters for SaaS startups
The SaaS industry continues to grow at a rapid pace, but with that growth comes intense competition. Capital efficiency is now a key differentiator for companies seeking to stand out with investors.
Here are three reasons capital efficiency matters:
1. Sustains growth
Capital enables early-stage SaaS companies to invest in critical functions like product development and headcount. But efficient use of that capital helps balance steady, strategic growth against “growth at all costs.”
2. Generates investor interest
Investors want to see strong fundamentals. For example, generating $1 million in ARR with a $2 million burn is far more compelling than the same revenue at a $5 million burn. Lower burn demonstrates that finance, sales, and marketing are working in alignment to improve efficiency.
3. Extends runway
In volatile market conditions, efficiency directly impacts runway. Overspending on marketing or miscalculating hiring needs can lead to layoffs—an outcome that signals inefficiency and undermines growth.
<<Build efficiency and impress investors with this due diligence checklist.>>
How to take your capital efficiency to the next level
Benchmarks vary by industry, but in general a 1:1 capital efficiency ratio is solid, while 3:1 is considered excellent. To optimize, finance leaders need to consider the full picture of financial health.
Additional ratios and metrics can provide deeper insights:
- CAC ratio: Compares customer acquisition cost (CAC) to revenue generated, highlighting how effectively sales and marketing dollars convert
- CAC payback period: Measures how long it takes for a new customer to become profitable
- Customer lifetime value (LTV): Tracks the total revenue expected per customer over their lifetime, informing retention and growth strategies
- Human capital efficiency: Looks at revenue per employee (FTE) to assess how well headcount supports ARR growth
- SaaS magic number: Evaluates sales efficiency by measuring how much ARR growth is generated per dollar spent on sales and marketing
Together, these metrics help finance teams identify where to adjust spending and how to forecast sustainable growth.
Key takeaways
- Capital efficiency measures how effectively a company uses its financial resources to generate revenue, crucial for sustainable growth
- Essential metrics like cash conversion score, burn multiple, and return on capital efficiency (ROCE) provide insights into a company’s financial health and scalability
- Efficient capital use can attract investor interest by showcasing a solid plan for growth, balanced spending, and extended runway during market fluctuations
- A focus on capital efficiency ensures that SaaS companies can optimize spending while positioning themselves as attractive investment opportunities
How to track and assess capital efficiency growth
Cash conversion score and related metrics are essential for evaluating growth—but the data required often lives across multiple spreadsheets and systems. Collecting and reconciling this information manually can be time-consuming, and by the time reports are ready, the insights may already be outdated.
This is where modern financial software tools play a critical role. By integrating directly with source systems, these platforms centralize data, automate calculations, and provide real-time dashboards. That means finance leaders can:
- Track cash conversion score and efficiency metrics continuously
- Drill down into key business drivers and trends
- Overlay forecasts to model future outcomes
- Collaborate with executives using accurate, up-to-date information
Rather than being reactive, companies gain the ability to proactively identify opportunities and address risks before they escalate.
Capital efficiency FAQs
How does capital efficiency differ from operational efficiency?
Capital efficiency measures how effectively a company generates revenue from invested dollars. Operational efficiency focuses on how well resources like people, materials, and technology are used to deliver products or services. The two are related—improving operations often supports stronger capital efficiency.
Can a startup with a low cash conversion score still be successful?
Yes. A low score often reflects early-stage realities, when companies invest heavily in product development, research, and customer acquisition. What matters is tracking the trend over time to ensure the business is moving toward stronger efficiency and eventual profitability.
How often should a company track its capital efficiency metrics?
For large, established businesses, quarterly reviews may be sufficient. But for fast-growing startups—or in uncertain market conditions—monthly tracking provides the agility to adjust strategy quickly.