
Financial clarity starts with understanding your company’s income statement. This essential financial document tells the story of your business’s profitability journey, revealing whether you’re generating profit or operating at a loss over a specific period.
In this article, we’ll walk through everything you need to know about income statements—from their key components to a step-by-step creation process—and provide a practical income statement template you can customize for your business, along with a real-world income statement example.
<<Download our free income statement template for Excel.>>
What is an income statement?
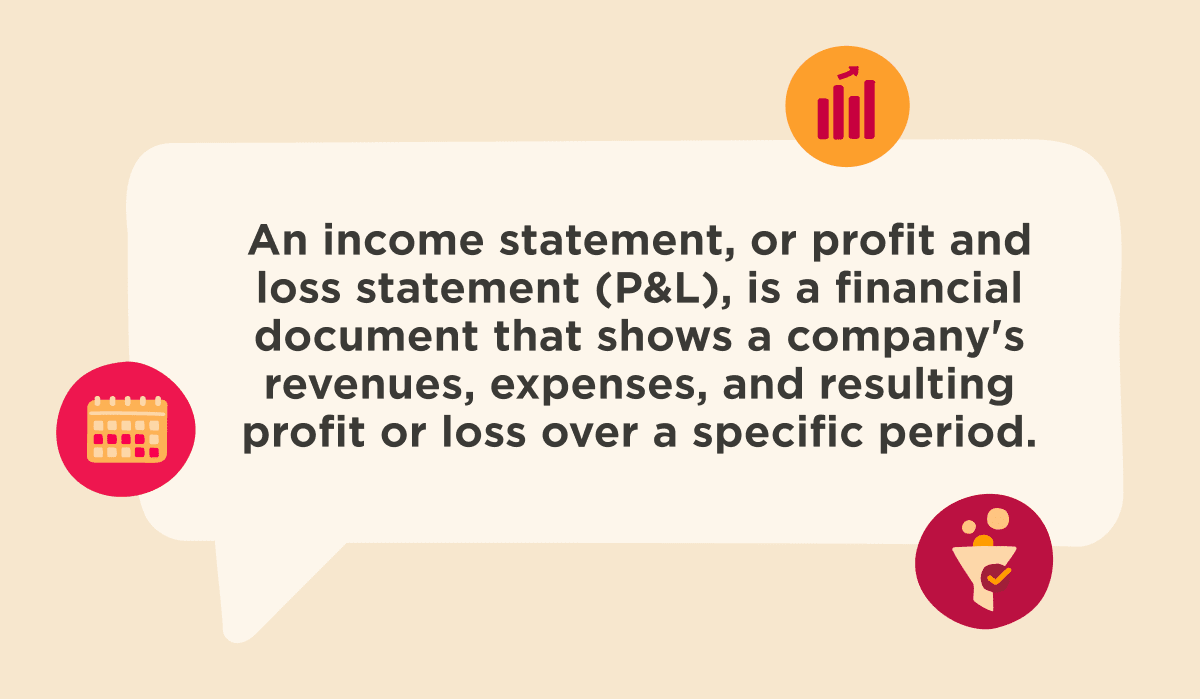
An income statement, also known as a profit and loss statement (P&L), is a financial document that shows a company’s revenues, expenses, and resulting profit or loss over a specific period. It reveals whether your business is generating profit or operating at a loss, providing a comprehensive picture of financial performance.
Income statements typically cover monthly, quarterly, or annual periods, allowing businesses to track performance over time and make informed financial decisions. However, some companies use a thirteen-period cycle instead of the typical monthly division.
Who uses an income statement?
An income statement is one of three primary financial statements, alongside the balance sheet and cash flow statement, that businesses use to evaluate their financial health and communicate with stakeholders.
It’s used by multiple stakeholders across and outside organizations, including:
- Business owners and executives: Track profitability trends, identify areas for cost reduction, and make strategic decisions about resource allocation
- Investors and shareholders: Analyze financial performance, profitability potential, and investment worthiness
- Lenders and creditors: Assess a company’s ability to generate sufficient profit to repay loans and meet financial obligations
- HR and finance departments: Plan workforce budgets, justify headcount decisions, and link personnel costs to revenue per employee
- Tax authorities: Verify reported income and ensure proper tax compliance
Income statement example
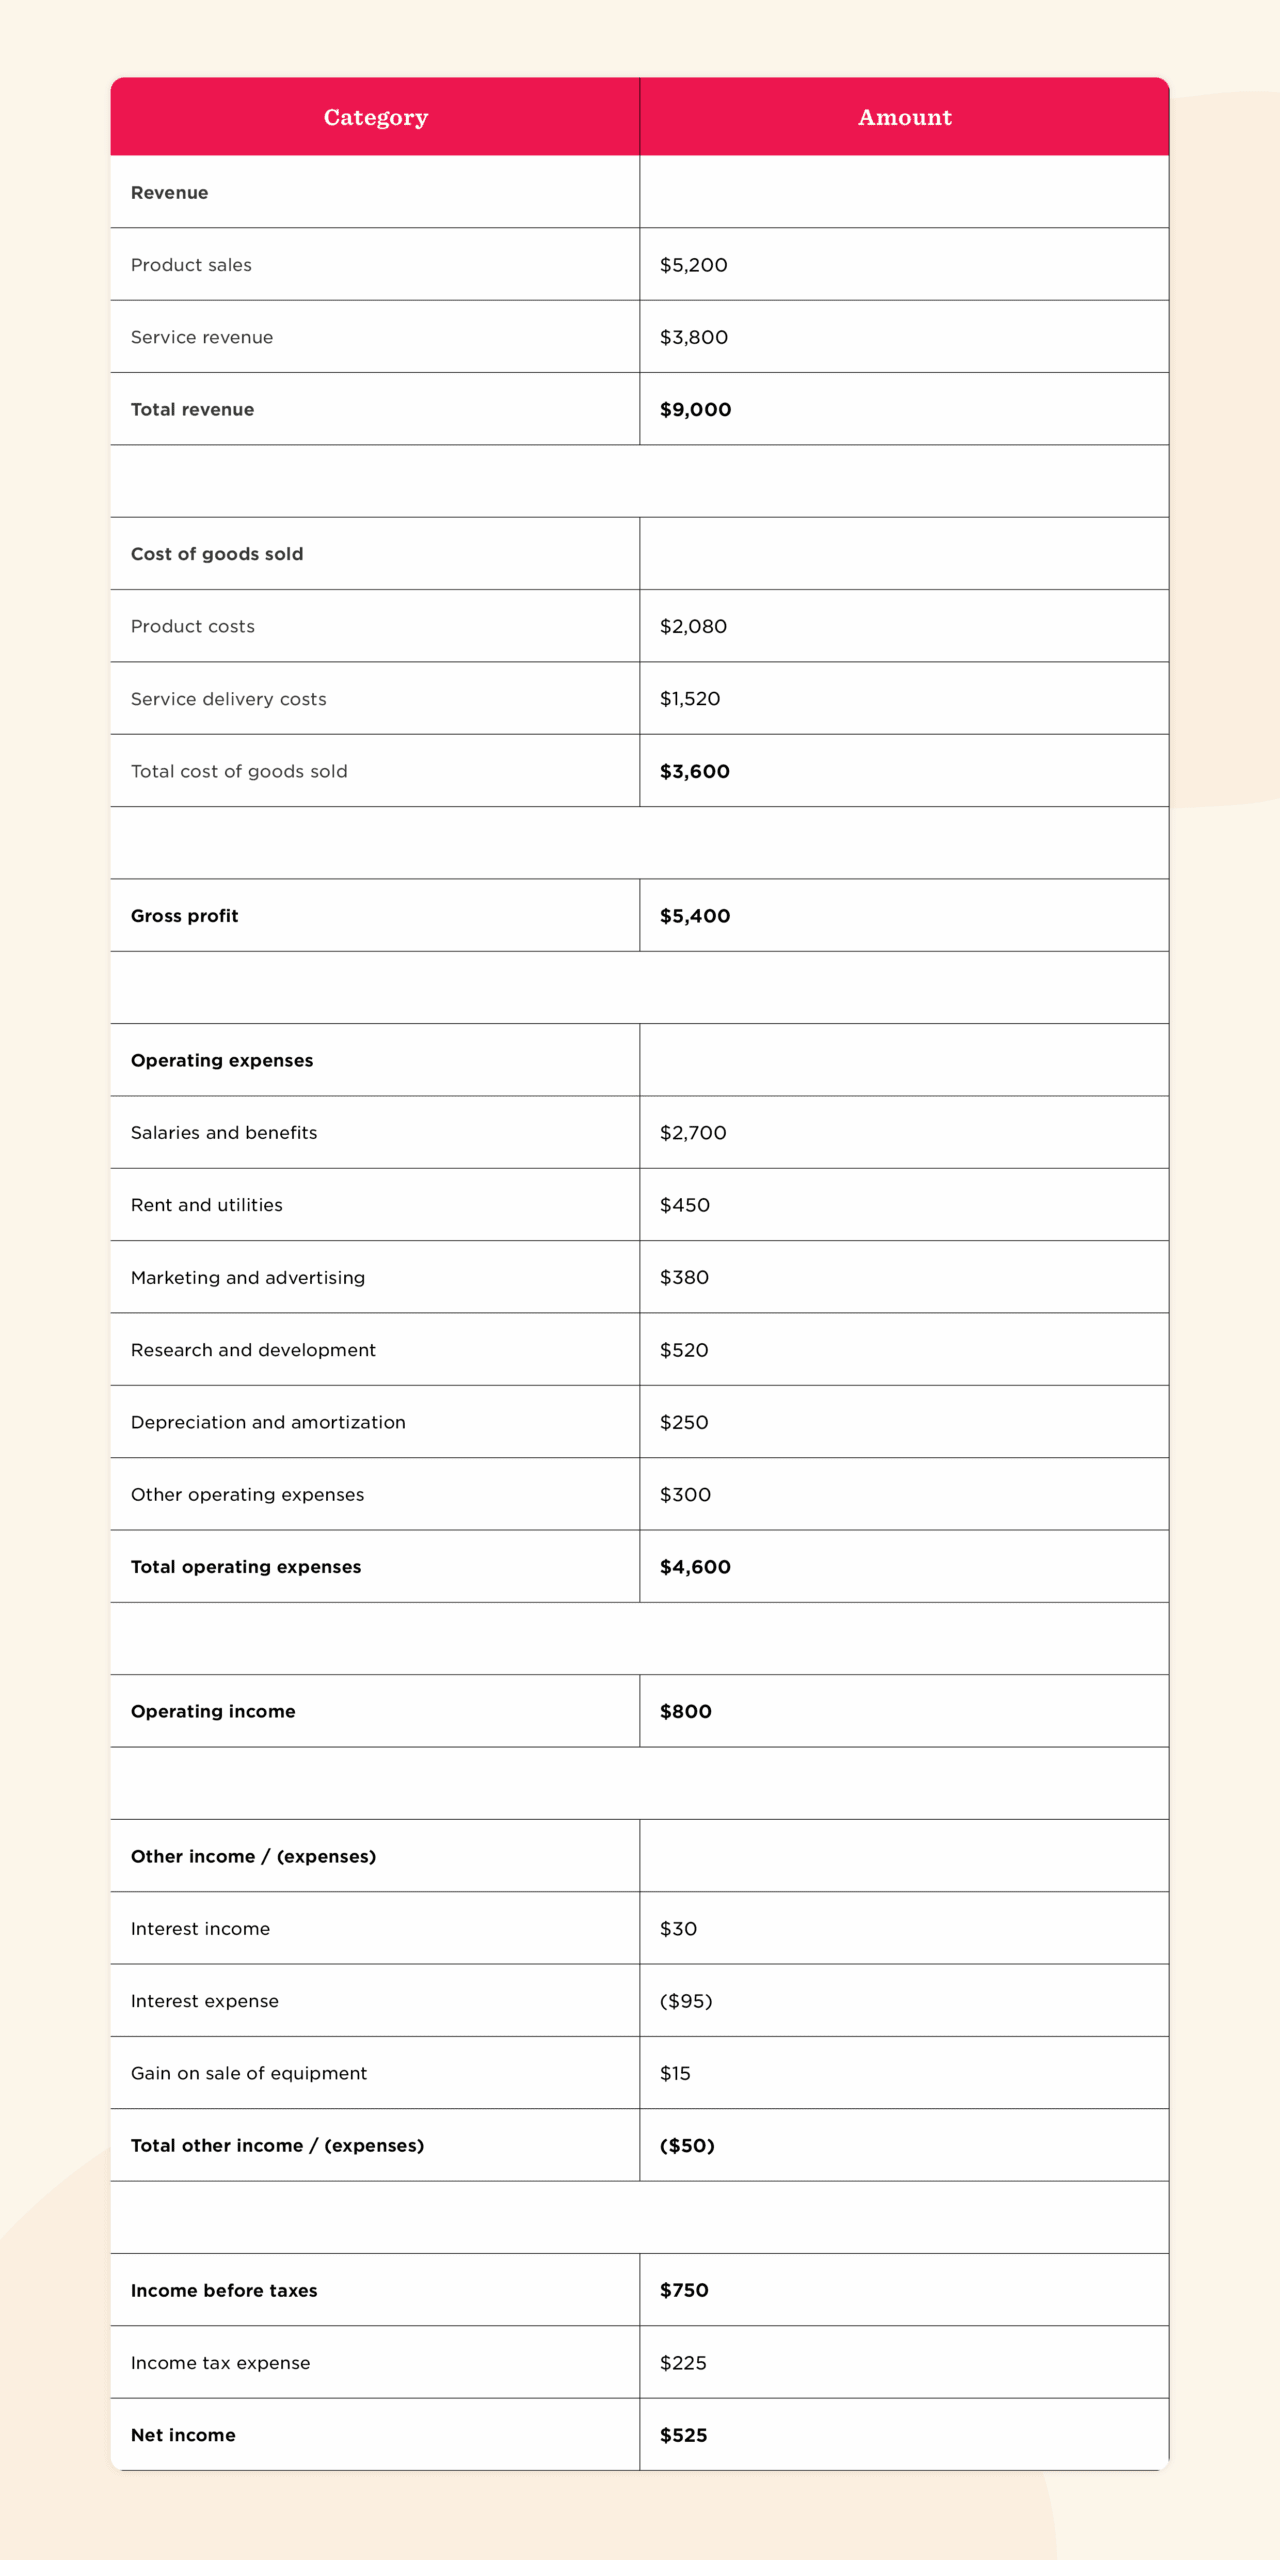
Below is a comprehensive income statement example for a fictional company, TechSolutions Inc., measured in the thousands.
This sample shows how TechSolutions generated $9 million in revenue, incurred $3.6 million in direct costs to produce its products and services, spent $4.6 million on operating expenses, and ultimately earned $525,000 in net profit after accounting for taxes and other items.
To use the template effectively:
- Input your revenue figures from all income sources
- Enter your cost of goods sold based on your accounting records
- Add your operating expenses by category
- Include any other income or expenses not related to core operations
- Enter your applicable tax rate or estimated tax expense
- Calculate the final net income figure
TechSolutions Inc.
Income statement
<<Download our free income statement template.>>
Income statement template for Excel
Creating your own income statement becomes simpler with a ready-to-use template. Our downloadable income statement template provides a structured format that you can customize for your business needs.
| Category | Amount |
| Revenue | |
| Product sales | |
| Service revenue | |
| Total revenue | |
| Cost of goods sold | |
| Product costs | |
| Service delivery costs | |
| Total cost of goods sold | |
| Gross profit | |
| Operating expenses | |
| Salaries and benefits | |
| Rent and utilities | |
| Marketing and advertising | |
| Research and development | |
| Depreciation and amortization | |
| Other operating expenses | |
| Total operating expenses | |
| Operating income | |
| Other income / (expenses) | |
| Interest income | |
| Interest expense | |
| Gain on sale of equipment | |
| Total other income / (Expenses) | |
| Income before taxes | |
| Income tax expense | |
| Net income |
It’s important to use consistent date formats and currency symbols when filling out a blank template. You should also save a blank master copy for reuse each period and create version-controlled files for each reporting cycle.
<<Download our free income statement template.>>
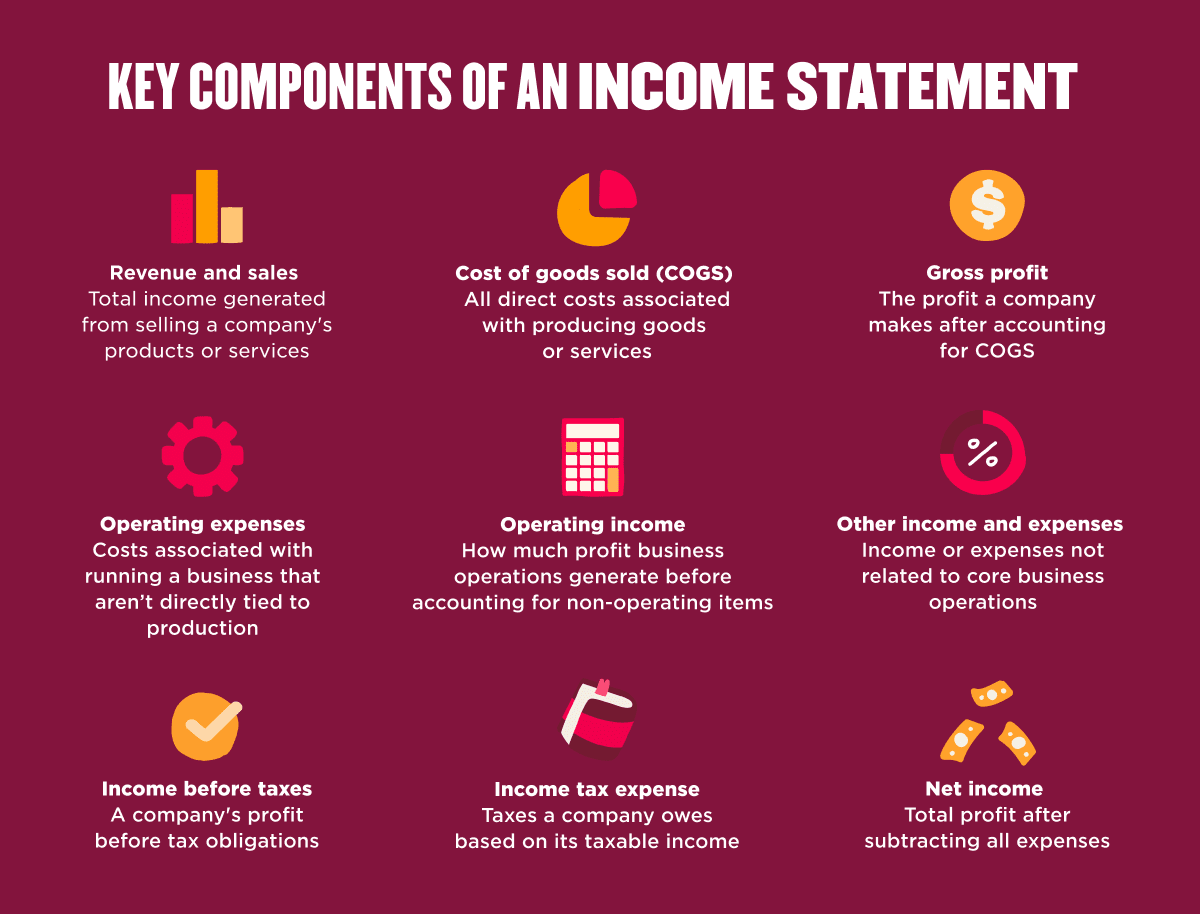
Key components of an income statement
Understanding each section of an income statement helps you interpret the financial story it tells about your business. Here are the essential components you’ll find in a standard income statement:
- Revenue and sales: Revenue represents the total income generated from selling your company’s products or services before any expenses are deducted. This “top line” figure shows the total inflow of funds from your primary business activities during the reporting period. Revenue may be broken down by product lines, services, or geographical regions to provide more detailed insights.
- Cost of goods sold (COGS): COGS includes all direct costs associated with producing the goods or services your company sells. These costs typically include raw materials, direct labor, and overhead directly tied to production. For service businesses, COGS might include labor costs for billable hours and any materials used to deliver services.
- Gross profit: Gross profit equals revenue minus COGS, representing the profit your company makes after accounting for the direct costs of producing goods or services. This figure helps assess your basic profitability before considering operating expenses. Gross profit margin (gross profit divided by revenue) indicates the efficiency of your core business operations.
- Operating expenses: Operating expenses cover all costs associated with running your business that aren’t directly tied to production, also known as the compensation expense factor. These typically include salaries, wages, and benefits for non-production team members, rent and utilities, marketing and advertising, research and development, office supplies and equipment, insurance, and travel expenses.
- Operating income: Operating income (or operating profit) equals gross profit minus operating expenses. This figure shows how much profit your core business operations generate before accounting for non-operating items such as interest and taxes. Operating income provides insight into how efficiently your business runs its day-to-day operations.
- Other income and expenses: This includes income or expenses not related to your core business operations. This may include anything from interest income from investments and interest expense on loans to gains or losses from selling assets, and foreign exchange gains or losses.
- Income before taxes: Income before taxes (pre-tax income) combines operating income with other income and expenses to show your company’s profit before tax obligations. This figure helps compare profitability across companies that might face different tax situations.
- Income tax expense: This line shows the amount of taxes your company owes based on its taxable income. Tax expenses can vary based on your business structure, applicable tax rates, and available deductions or credits.
- Net income: Net income, often called the “bottom line,” represents your company’s total profit after subtracting all expenses, including taxes. This final figure shows how much profit your company ultimately earned or lost during the reporting period. Net income can be retained in the business for growth or distributed to shareholders as dividends. Publicly-held companies must also disclose basic and diluted earnings per share on the face of the income statement.
How to prepare an income statement
Follow these steps to prepare a comprehensive income statement for your business.
Step 1: Gather financial data
Begin by collecting all financial records relevant to the reporting period. This includes sales receipts, expense reports, bank statements, payroll data, and previous financial statements. Organize these documents chronologically and by category to simplify the data entry process.
Using financial planning and analysis software can significantly streamline this step by automatically categorizing and storing financial transactions.
Step 2: Calculate total revenue
Determine your total revenue by adding up all income generated during the reporting period. Include all revenue streams relevant to your business:
- Sales revenue: Income from primary business activities
- Service revenue: Income from services provided
- Interest revenue: Income from investments or loans
- Other income: Miscellaneous revenue sources
Recognizing revenue in the right accounting period keeps your financials accurate and your business insights sharp. It helps teams make smarter decisions and gives stakeholders a clear view of performance.
Step 3: Subtract cost of goods sold (COGS)
Calculate your COGS by adding up all direct costs associated with producing your goods or services. The basic formula is:
COGS = Beginning inventory + purchases – ending inventory
For different business types, COGS includes different elements:
- Product businesses: Raw materials, direct labor, manufacturing overhead
- Service businesses: Billable staff costs, subcontractor fees, project materials
- Retail businesses: Inventory purchases, freight-in, direct handling costs
- Hybrid businesses: Combination of product and service costs
Step 4: Determine gross profit
Calculate your gross profit by subtracting COGS from your total revenue:
Gross profit = Total revenue – COGS
This figure represents your profit before accounting for operating expenses. Calculate your gross profit margin by dividing gross profit by total revenue and multiplying by 100:
Gross profit margin = (Gross profit ÷ total revenue) × 100%
Profit margin tells you how much money your business keeps after covering costs—it’s a quick gut check on financial health. Tracking it helps you spot opportunities to cut waste, boost efficiency, and stay competitive.
A healthy gross profit margin varies by industry but typically ranges from 50 percent to 70 percent for many businesses.
Step 5: Subtract operating expenses
List and total all operating expenses incurred during the reporting period. These are costs associated with running your business that aren’t directly tied to production. Common operating expenses include:
- Administrative salaries and benefits
- Rent and utilities
- Office supplies and equipment
- Marketing and advertising costs
- Research and development
- Insurance premiums
- Professional fees (legal, accounting)
Proper payroll management is essential for accurately reporting salary and benefit expenses, which often represent the largest operating expense category.
Step 6: Account for taxes and other deductions
Calculate non-operating items that affect your final profit figure:
- Add any non-operating income (interest income, gains from asset sales)
- Subtract any non-operating expenses (interest expense, losses from asset sales)
- Calculate your income before taxes
- Apply the appropriate tax rate to determine your income tax expense
Tax calculations can be complex based on your business structure, jurisdiction, and available deductions. Consider consulting with a tax professional to ensure accuracy.
Step 7: Calculate net income
The final step is determining your net income (or net profit) by subtracting income tax expense from your income before taxes:
Net income = Income before taxes – income tax expense
This “bottom line” figure represents your company’s final profit or loss for the reporting period. A positive net income indicates your business is profitable, while a negative figure represents a loss.
Best practices for making an income statement
Follow these best practices to ensure your income statements provide accurate, useful financial information:
- Consistency is key: Use the same accounting methods and categorization from period to period to enable meaningful comparisons
- Be comprehensive: Include all revenue and expense items relevant to the reporting period, even small or unusual ones
- Follow proper timing: Record revenues when earned and expenses when incurred, regardless of when cash changes hands
- Provide context: Include comparative figures from previous periods to highlight trends and changes in performance
- Add supplementary notes: Explain unusual items or significant changes that might not be obvious from the numbers alone
- Ensure accuracy: Double-check all calculations and reconcile with source documents before finalizing your statement
- Use accounting standards: Follow Generally Accepted Accounting Principles (GAAP) or International Financial Reporting Standards (IFRS)
Regular income statement analysis allows you to identify trends, spot potential issues early, and capitalize on opportunities for growth. Using our income statement template, you can create professional financial statements that clearly communicate your business’s profitability story.
<< Download our free income statement Excel template. >>
Income statement example FAQs
How do I make an income statement?
Creating an income statement involves gathering financial data, calculating revenue, subtracting costs and expenses, accounting for taxes, and determining net income for the reporting period. You’ll list all revenue streams first, followed by the direct costs associated with delivering your product or service (known as cost of goods sold, or COGS). Subtracting COGS from total revenue gives you gross profit.
From there, you deduct operating expenses like salaries, rent, marketing, and depreciation to calculate operating income. Finally, account for any non-operating income or expenses (like interest or asset sales) and subtract taxes to arrive at your net income. A well-structured income statement example can help guide you through this process.
What are the main components of an income statement?
An income statement breaks down your business’s financial performance into a few key parts: revenue, cost of goods sold (COGS), gross profit, operating expenses, and net income. It’s a snapshot of what you earned, what you spent, and what you actually kept.
What is the difference between an income statement and a balance sheet?
The income statement shows how much a company earned or lost over a specific period. It’s focused on profitability—tracking the company’s revenue, expenses, and net income.
In contrast, the balance sheet shows a company’s financial position at a single point in time, detailing assets, liabilities, and equity. Together, these two documents give a more complete picture of financial health, but they serve very different purposes.
How often do businesses prepare income statements?
Businesses typically prepare income statements on a monthly, quarterly, and annual basis, depending on their size and financial reporting requirements.
- Monthly statements help track short-term performance and make immediate operational decisions
- Quarterly reports are often used for board meetings and investor updates
- Annual statements are crucial for tax filings, audits, and strategic planning
Why is the income statement important for small businesses?
For small businesses, the income statement is a vital tool for understanding where money is coming from and where it’s going. It helps answer questions like:
- Are sales increasing month over month?
- Are expenses growing faster than revenue?
- Is the business profitable?
This insight supports better budgeting, resource allocation, and long-term planning.
Recommended For Further Reading
Are income statements required for all businesses?
While not legally required for all small businesses, income statements are essential for:
- Applying for business loans or credit
- Attracting investors
- Filing accurate taxes
- Making informed financial decisions
LLCs, corporations, and any business with investors or lenders are usually expected to produce regular income statements.
What’s the difference between operating and non-operating income?
Operating income includes earnings from the core business—like product sales or service revenue minus operating expenses.
Non-operating income includes gains or losses not tied to day-to-day operations, such as interest income, investment gains, or the sale of company assets. Separating these helps stakeholders see how well the business performs from its primary activities.