
An HR metric is a simple measurement of something in the workforce or an HR process.
Organizations generate more workforce data than ever. But more data doesn’t automatically mean more clarity.
HR’s value increasingly lies in making sense of those signals, understanding the context behind them, and helping leaders act. Because behind every number are people building careers, staying connected, building new skills, and doing work that matters.
The most useful HR metrics help turn those signals into a clearer picture of what’s changing across the workforce, and where leaders may need to look more closely.
Key insights: HR metrics that matter
- HR metrics are signals, not answers. They show where to investigate, while context helps explain what may be driving the change.
- The best metrics start with the decision. Choose the measure (or combination of measures) that helps answer a real workforce or business question.
- Benchmarks add context, not universal targets. Compare external reference points with your own workforce, market, goals, and historical trends.
- Connected data reveals the bigger picture. Looking across hiring, engagement, retention, skills, compensation, and performance can surface relationships that isolated metrics miss.
- AI can help surface patterns faster. Trusted data, clear standards, appropriate governance, and human judgment still determine what those patterns mean and what happens next.
What are HR metrics?
HR metrics are quantitative measures organizations use to understand workforce trends, evaluate people programs and processes, and inform decisions about hiring, retention, engagement, performance, compensation, skills, and organizational health.
A metric tells you what happened. Context and analysis help explain why it may be happening, what deserves further investigation, and what decisions leaders need to make next.

Why HR metrics matter for business decisions
Workforce and business decisions are increasingly difficult to separate.
Deloitte’s 2026 Global Human Capital Trends research found that 7 in 10 business leaders say their primary competitive strategy over the next three years is to be fast and nimble.
HR metrics can bring workforce evidence to questions the leaders across the business are already asking:
- Can we hire quickly enough to support growth?
- Where are we losing critical skills?
- Are people developing the capabilities the business will need next?
They can also help HR connect those workforce signals to the decisions behind them, from where to invest and which capabilities to build to where emerging risks may need attention.
The goal is to turn workforce data into better decisions, rather than simply reporting more KPIs.
AI supports the work. People lead it.
AI and modern analytics can make patterns across workforce data easier to identify.
HiBob’s 2026 research on AI skills maturity found that 75 percent of AI decision-makers expect moderate AI proficiency to become standard across most non-technical roles within two years. This shift raises the bar for how people use AI across their organizations: with trusted data, clear standards, appropriate governance, and people who know how to interpret what the technology surfaces.
More analysis doesn’t remove the need for trustworthy data, shared definitions, appropriate permissions, business context, or human judgment. AI can support the work, but people remain accountable for the decisions that follow.
So which HR metrics are worth paying attention to? The following metrics can help HR understand how hiring, engagement, retention, DEI&B, and workforce performance are changing.
HR metrics: What the numbers can tell you
| Metric | What it measures | Formula | What the signal can tell you | Benchmark/context |
| Time-to-fill | Time from opening a role to accepted offer | Acceptance date − requisition date | Hiring capacity and process friction | SHRM 2026 median: 39 days for nonexecutive roles |
| Time-to-hire | Candidate time in the hiring process | Acceptance date − candidate entry date | Candidate journey and hiring speed | Ashby 2026: median 30 days for business roles and 40 for technical roles |
| Quality-of-hire | New-hire contribution | Defined quality indicators | Whether hiring translates into performance | SHRM 2025: 20% of organizations measure it |
| Employee growth | Change in workforce size | Headcount change ÷ starting headcount × 100 | Workforce capacity | Compare with workforce plans and historical trends |
| Cost-per-hire | Average recruiting cost | Recruiting costs ÷ hires | Hiring investment | Compare similar roles, levels, markets, and hiring models |
| Offer acceptance | Share of offers accepted | Accepted offers ÷ offers × 100 | Candidate and market signals | Gem 2026 benchmark: 82% |
| Time-to-productivity | New-hire ramp time | Ramp days ÷ hires measured | Onboarding and manager support | Set benchmarks by role and expected ramp time |
| Engagement | Connection and commitment | Favorable responses ÷ responses × 100 | Workforce experience | Compare like-for-like surveys and historical trends |
| Attrition | Share of workforce leaving | Departures ÷ average headcount × 100 | Retention and skills risk | Segment by role, tenure, team, manager, or location |
| eNPS | Willingness to recommend the organization | % promoters − % detractors | Directional sentiment | Track against your historical baseline and survey context |
| Career path ratio | Promotions relative to lateral moves | Promotions ÷ total upward/lateral moves | Internal mobility | Interpret against your mobility and talent strategy |
| Salary change | Change in base salary | Salary change ÷ prior salary × 100 | Compensation investment | Compare across workforce groups |
| Absenteeism | Working time lost to absence | Absence time ÷ available time × 100 | Workforce health and continuity | UK sickness absence rate: 2.0% in 2025 |
| Presenteeism | Reduced capacity while working | No universal formula | Workload, health, and work design | Compare with wellbeing and productivity trends |
| L&D | Skills development and application | Depends on outcome measured | Workforce readiness and skills | Compare against defined capability goals |
| Pay gap | Compensation difference between groups | Pay difference ÷ higher-paid group × 100 | Potential pay disparities | Pew 2024: Women earned 85% of men’s median hourly earnings in the US |
| Salary range penetration | Position within a salary range | (Salary − min) ÷ range width × 100 | Pay positioning | Compare equivalent roles and levels |
| Salary average | Mean compensation | Total salaries ÷ people | Compensation patterns | Review medians and distributions alongside the average |
| Gender diversity ratio | Representation by gender | Men : women : non-binary employees : other gender categories | Representation | Compare across teams, levels, and functions |
| ERG participation | Participation in ERGs | Participants ÷ eligible population × 100 | Program participation | Track participation over time; don’t treat it as a proxy for belonging |
| DEI&B initiatives | Progress against defined initiatives | Depends on initiative | Representation, access, and outcomes | Use multiple quantitative and qualitative signals |
| Revenue per employee | Revenue relative to workforce size | Revenue ÷ headcount | Productivity and capacity | Highly industry-dependent |
| Labor cost % | Workforce cost relative to revenue | Labor costs ÷ revenue × 100 | Workforce investment | Compare over time and against your business model |
| Productivity | Output relative to labor input | Output ÷ labor input | Operational performance | Define output and comparison points for your organization |
| Human capital ROI | Return relative to workforce investment | Adjusted return ÷ compensation costs | Estimated financial return on workforce investment | Compare with similar organizations and your own historical performance |

Recruitment metrics
1. Time-to-fill and time-to-hire
Time-to-fill measures the number of days between the opening or approval of a role and a candidate accepting the offer.
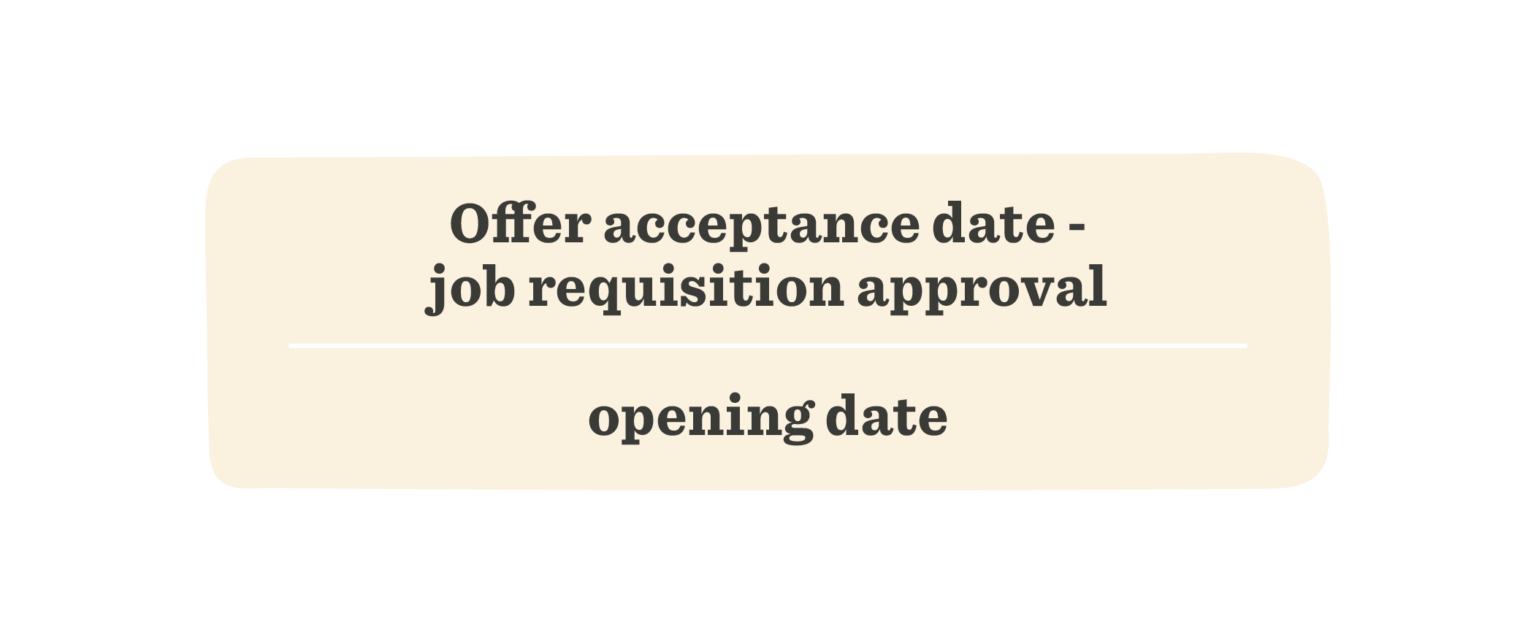
Time-to-hire measures how long a candidate spends in the recruitment process.
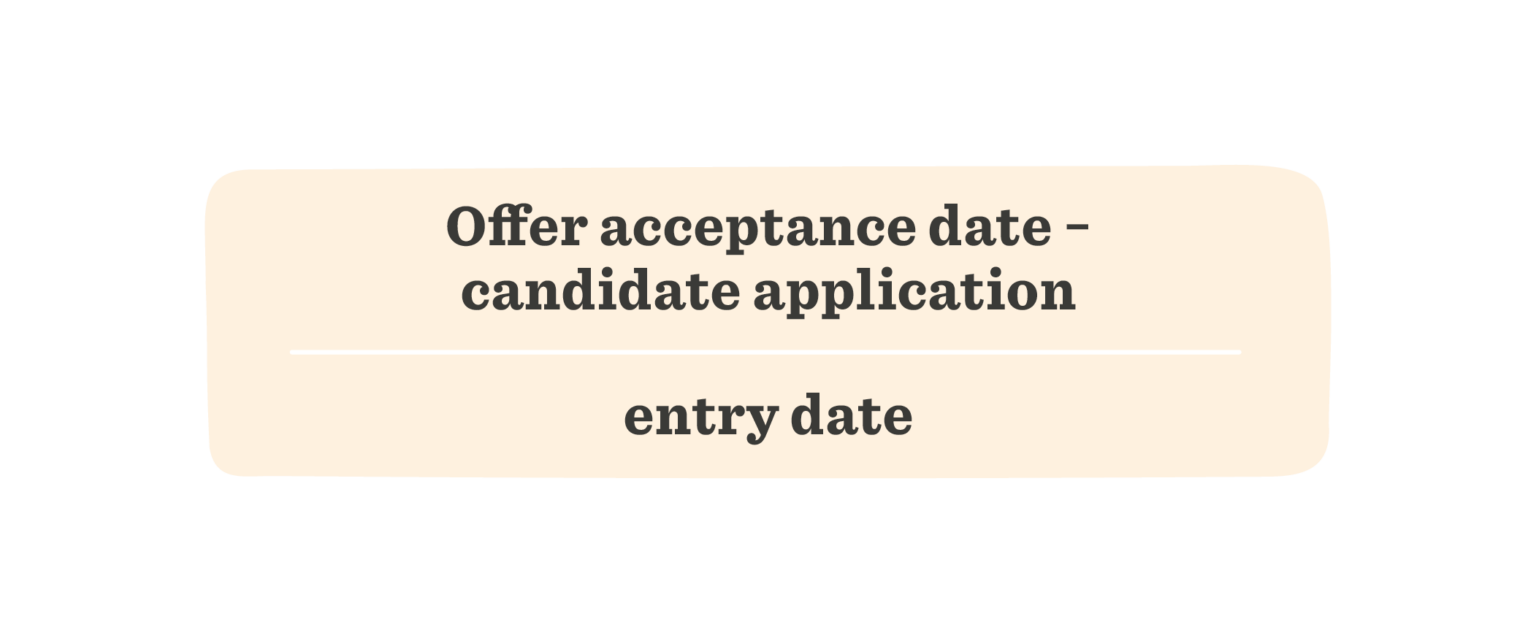
Longer times may point to sourcing challenges, approvals, interview complexity, or market conditions. But shorter isn’t automatically better, either. An unusually fast process may also deserve investigation if speed comes at the expense of hiring quality.
2. Quality-of-hire
Quality-of-hire measures the contribution of new hires after joining an organization.
There’s no universal formula. Instead, organizations may combine performance, retention, time-to-productivity, manager feedback, or engagement indicators depending on what “quality” means for the role and business.
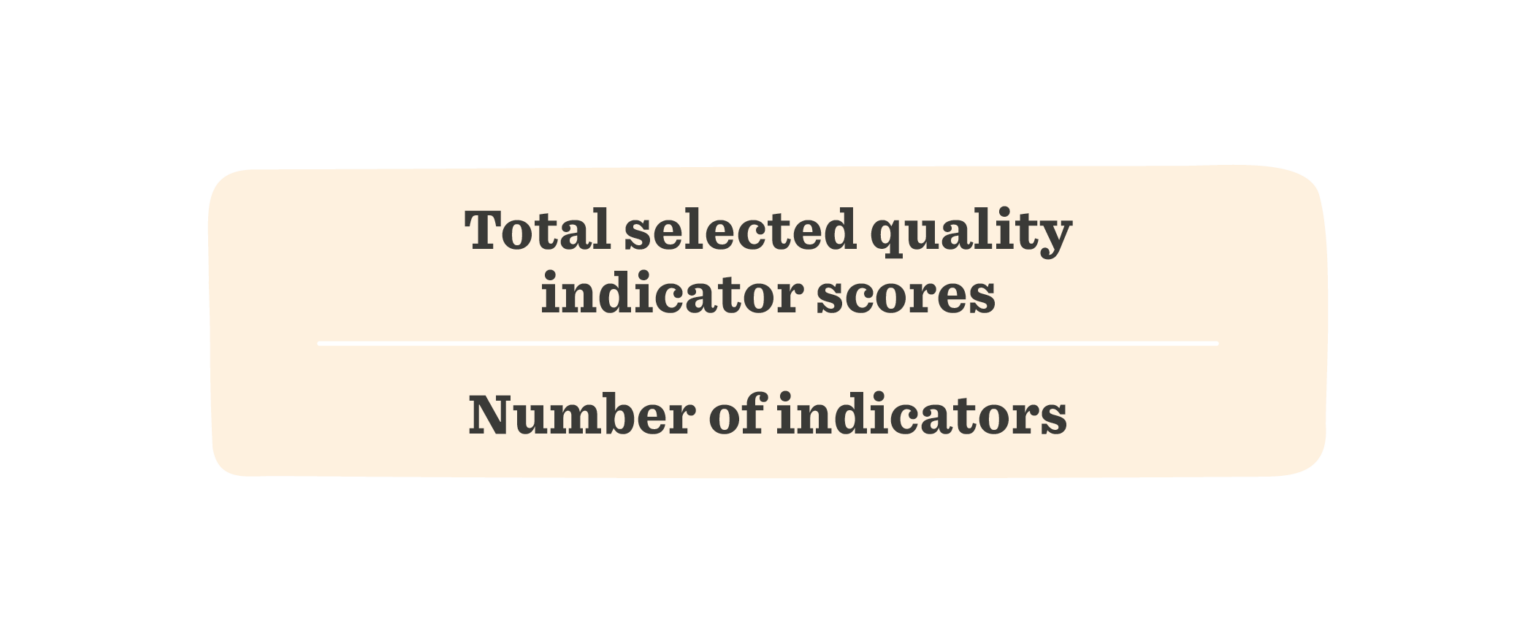
Because organizations define quality differently, they also calculate their quality-of-hire around different indicators and formulas.
This lack of standardization helps explain why only 20 percent of organizations in SHRM’s 2025 benchmarking reported measuring quality-of-hire. Linking recruitment data with the employee performance metrics your organization uses to define hire quality can show whether hiring decisions translate into the outcomes you intended.
3. Employee growth rate
Employee growth rate measures how workforce size changes over a defined period.
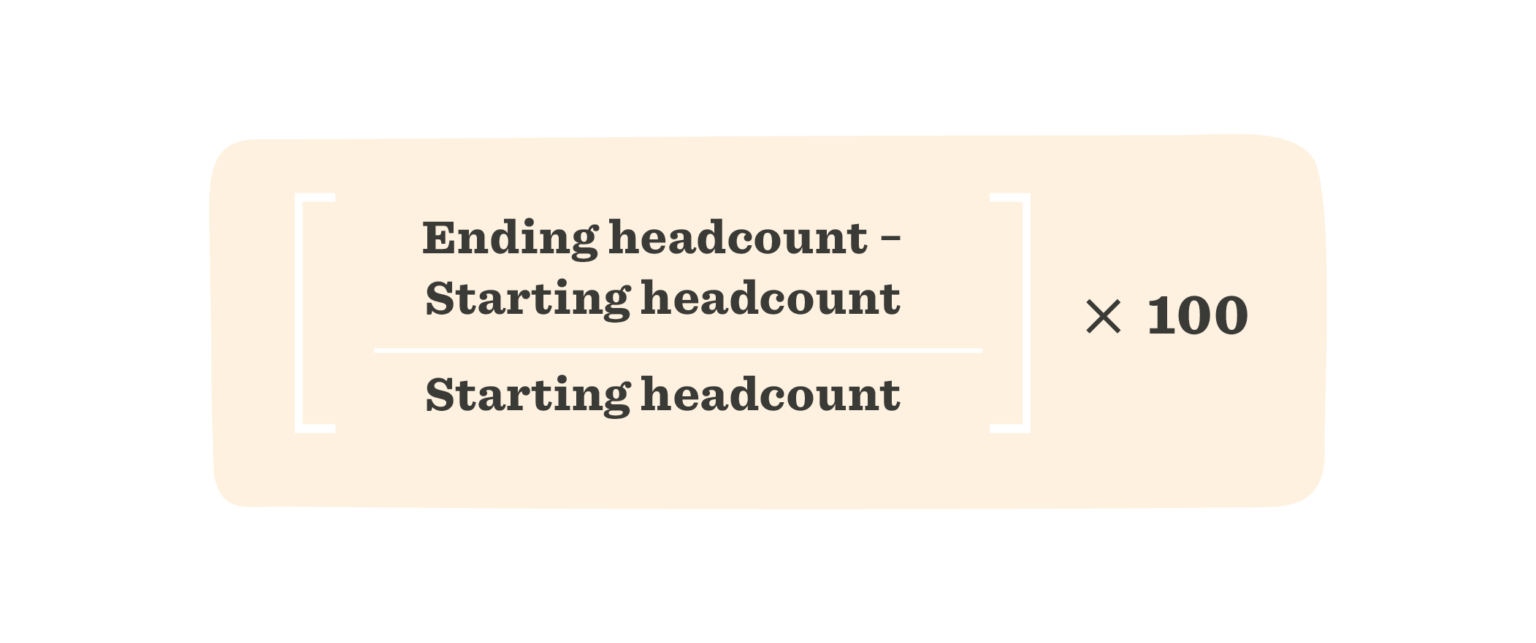
Positive growth doesn’t automatically mean a healthy organization. Its meaning depends on business context.
4. Cost-per-hire
Cost-per-hire measures the average recruitment cost businesses associate with each new hire.
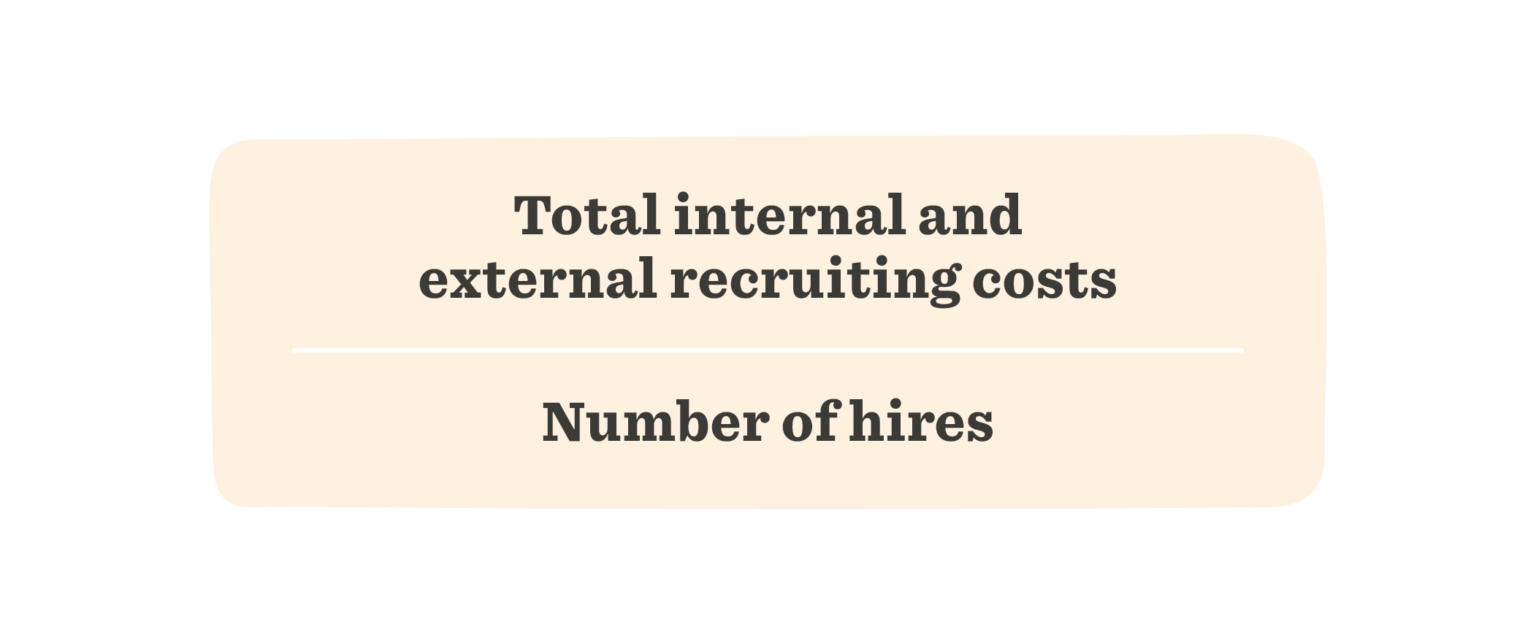
It can help HR and Finance understand recruitment investment and plan future hiring costs. Cost-per-hire can vary significantly by role, seniority, market, and recruitment model, so it’s most useful when compared with similar hires and your own historical data.
5. Offer acceptance rate
Offer acceptance rate measures the percentage of candidates who accept job offers.
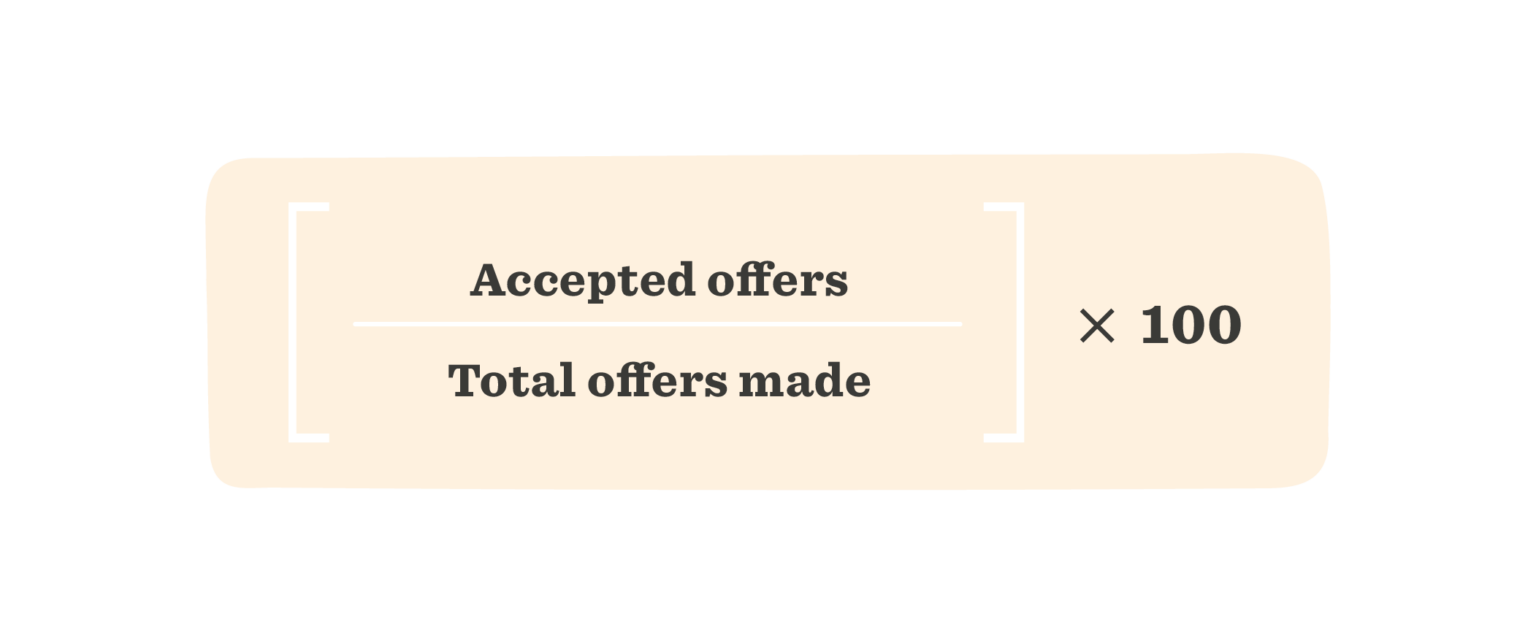
Changes can signal shifts in compensation competitiveness, candidate experience, employer reputation, role design, or labor-market conditions.
6. Time-to-productivity
Time-to-productivity measures how long it takes new hires to reach a defined level of effectiveness.
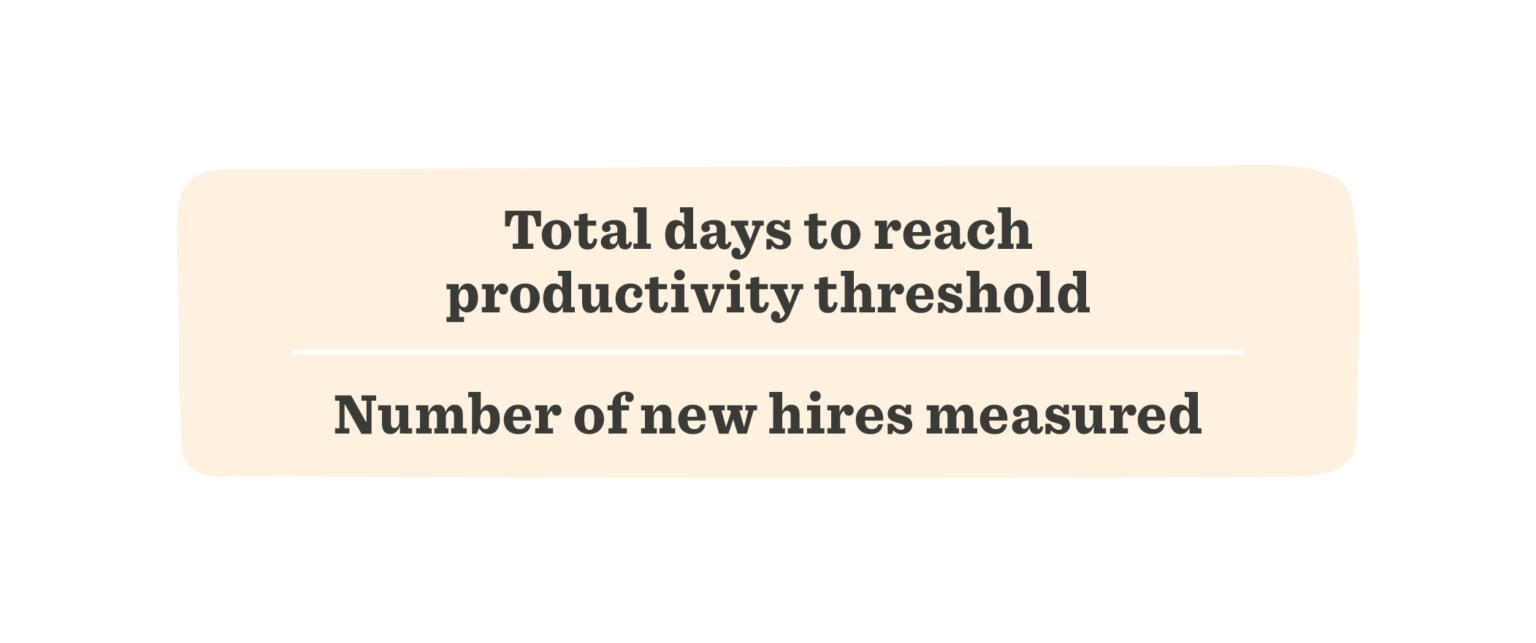
Viewed alongside onboarding and performance data, it can show whether people have the support, tools, and manager guidance they need to contribute.
Engagement and retention metrics
1. Employee engagement score
Employee engagement scores measure people’s connection and commitment to their work and organization across defined survey drivers.
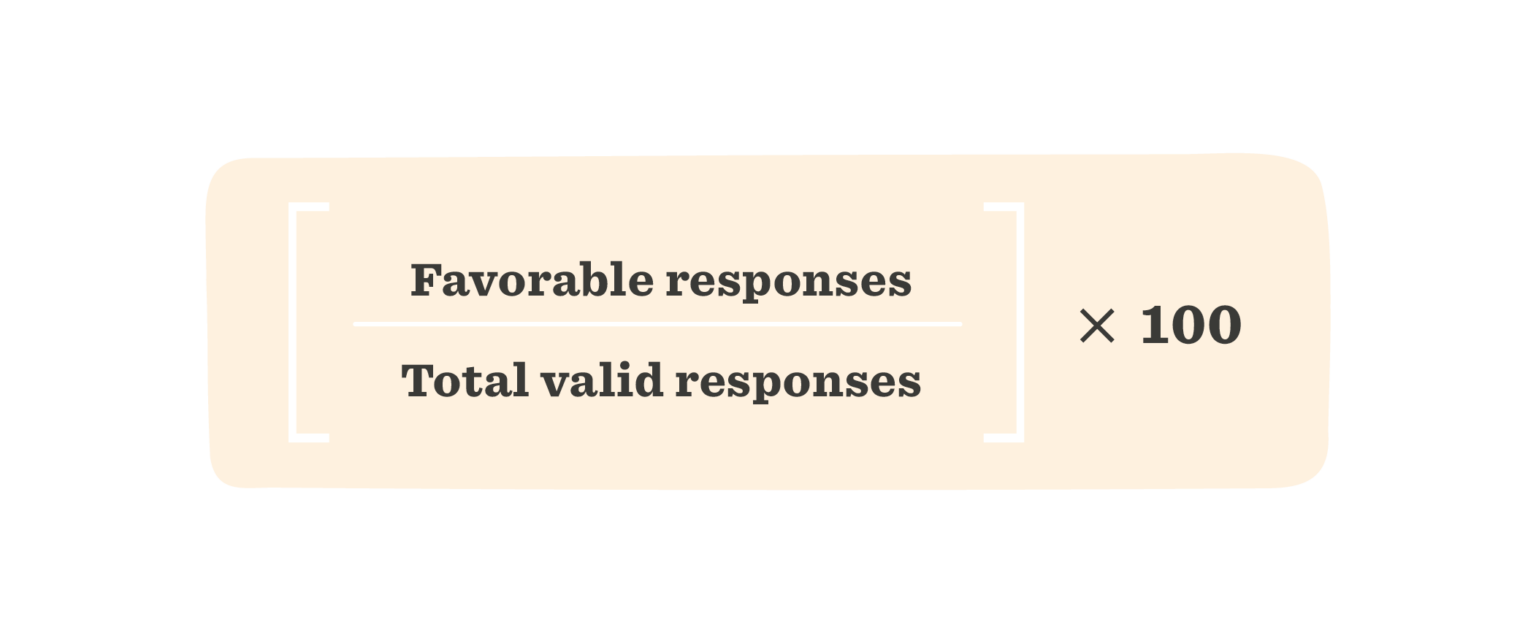
Engagement isn’t the same as happiness or satisfaction. Look at underlying drivers and differences between teams or groups to understand what people may be experiencing and what deserves further investigation.
2. Turnover and attrition rate
Attrition rate measures the percentage of people who leave during a specified period.
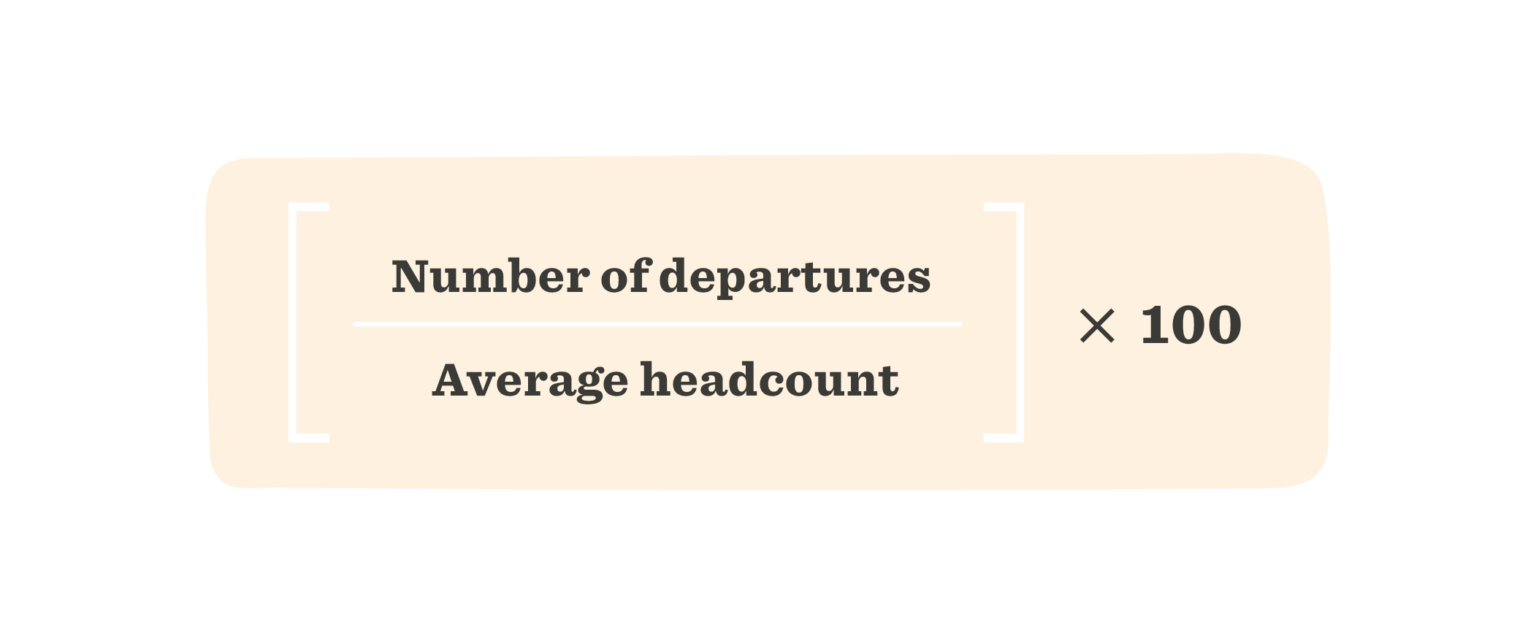
An organization-wide figure can hide the more important story. Segmenting by critical role, tenure, team, manager, or location can reveal where skills and experience are being lost.
3. eNPS
Employee Net Promoter Score (eNPS) measures people’s willingness to recommend their organization as a place to work.
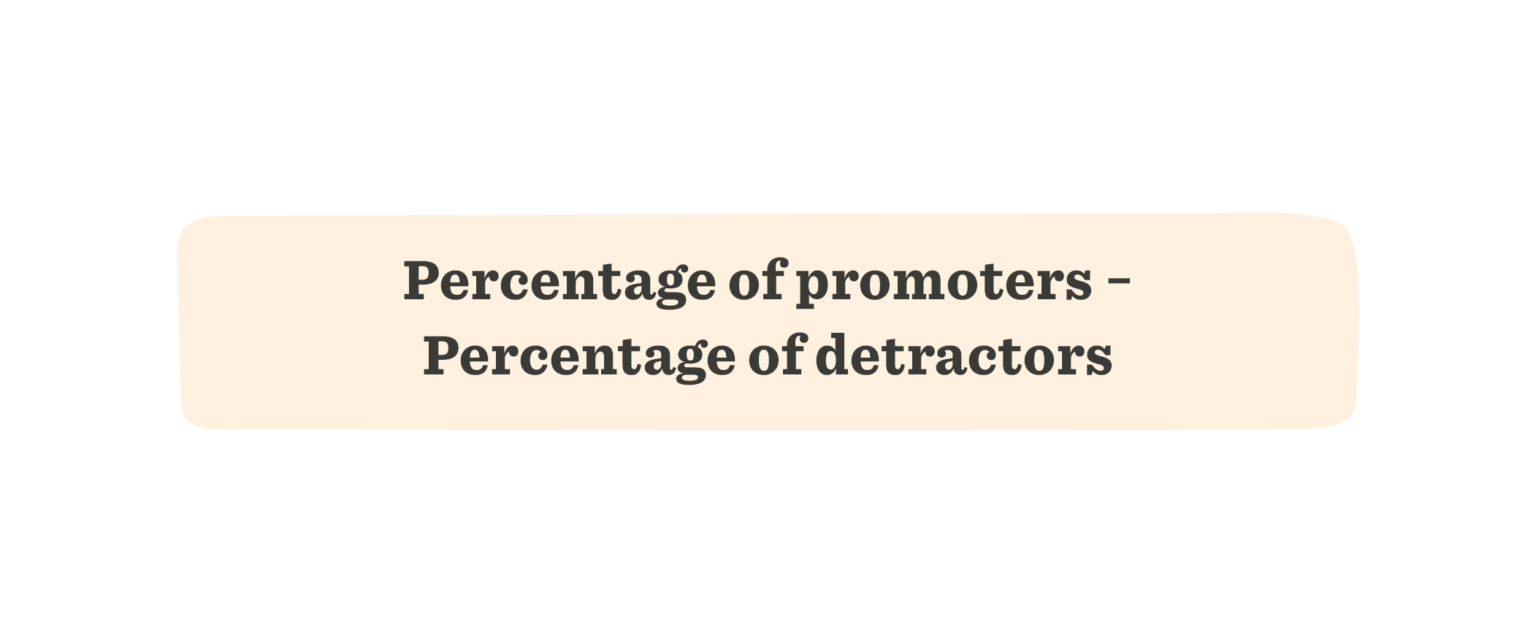
eNPS is a directional indicator rather than a complete measure of employee engagement. Open responses and segmentation can provide the context behind the score.
4. Career path ratio
The career path ratio compares promotions to lateral moves.
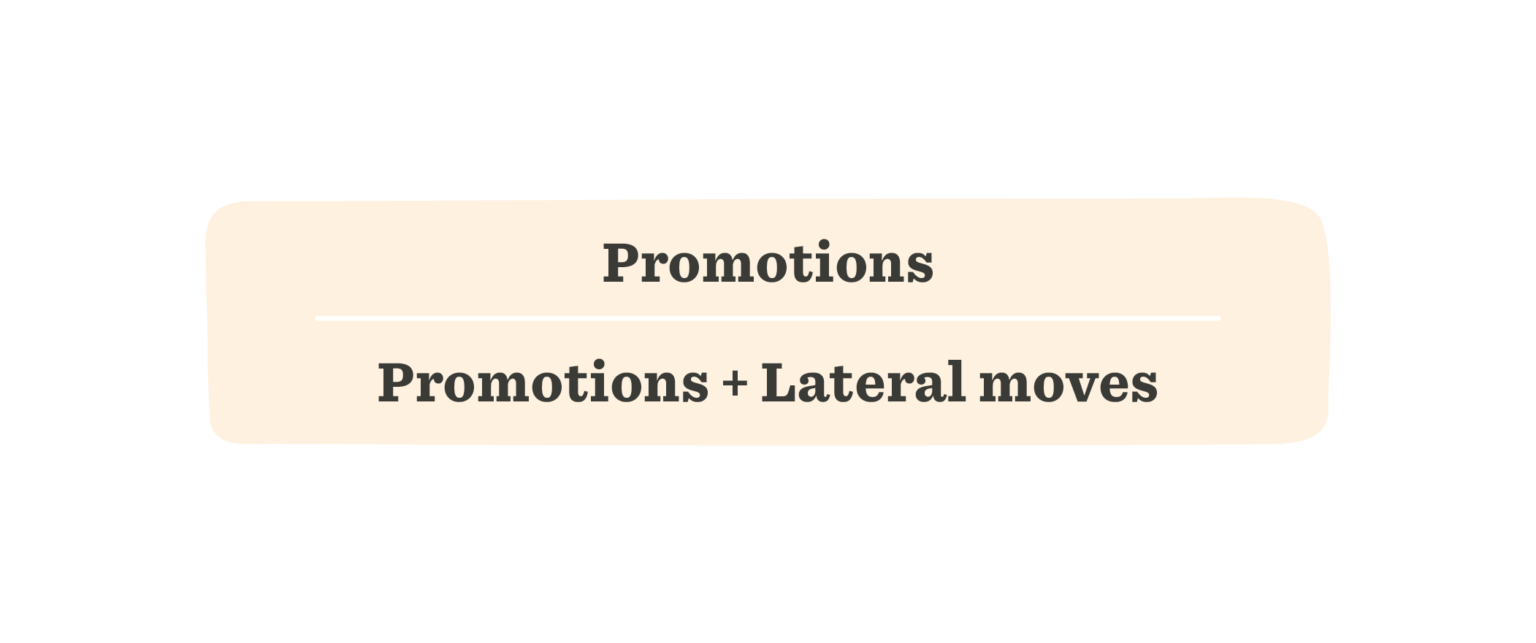
Combined with skills and mobility data, it can show how people are developing and whether opportunities exist beyond traditional promotion.
5. Salary change
Salary change measures the change in total base salary between two periods.
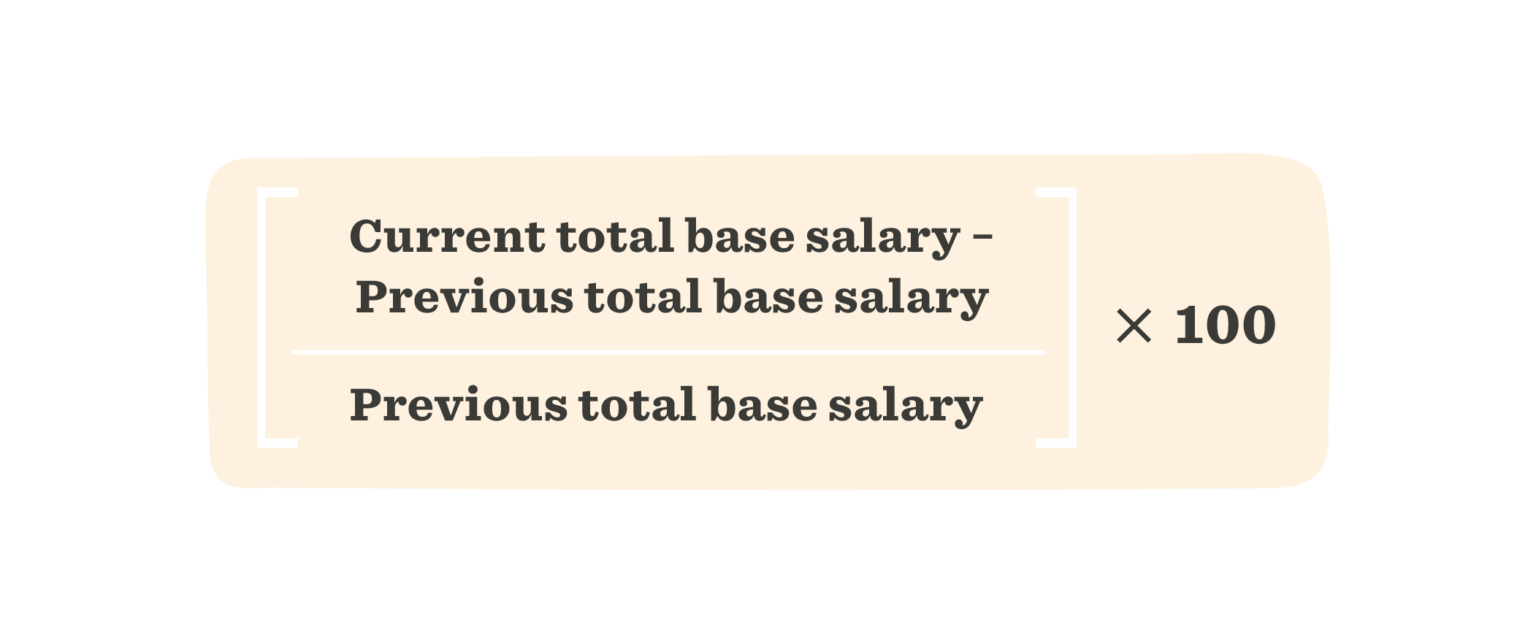
It can support compensation planning and add context to retention analysis alongside career development, management, and workload.
6. Absenteeism rate
Absenteeism rate measures working time lost to absence over a defined period.
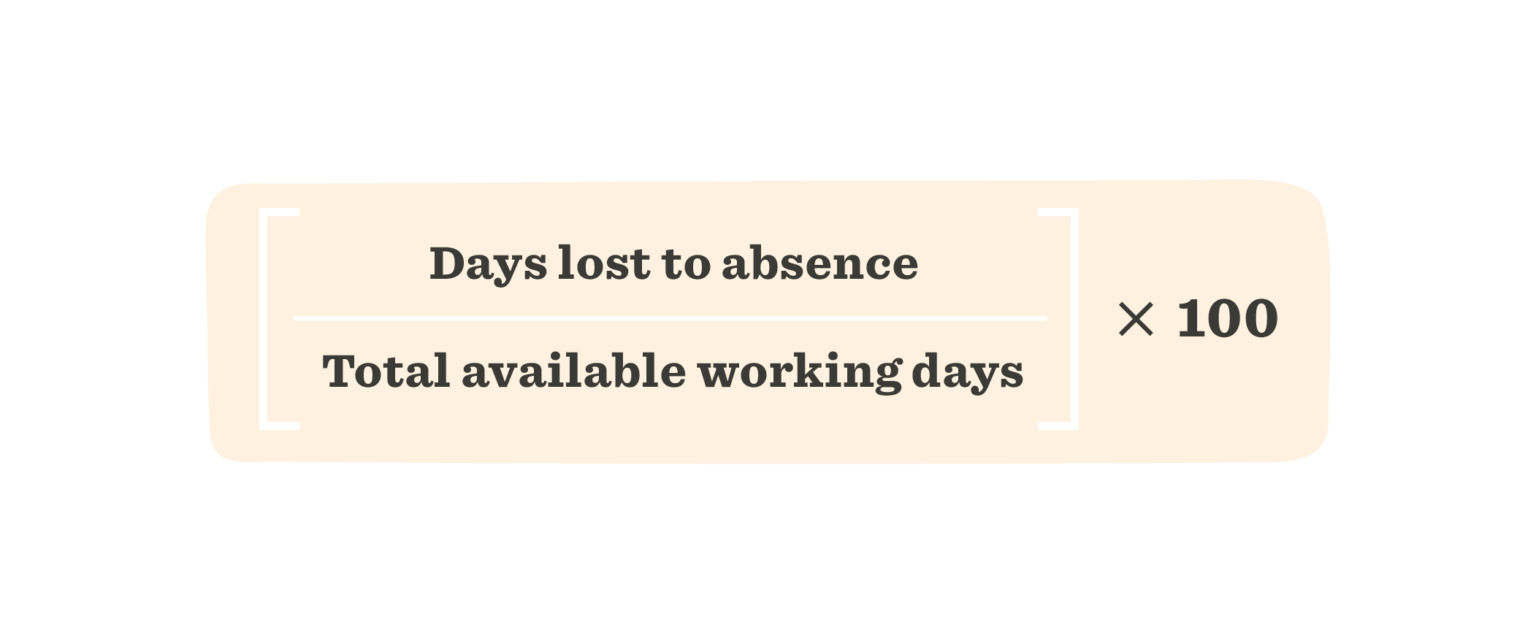
Look for patterns connected to workload, wellbeing, working conditions, and operational continuity rather than treating absence as an individual scorecard.
The Bradford Factor is another method organizations sometimes use to measure absenteeism:
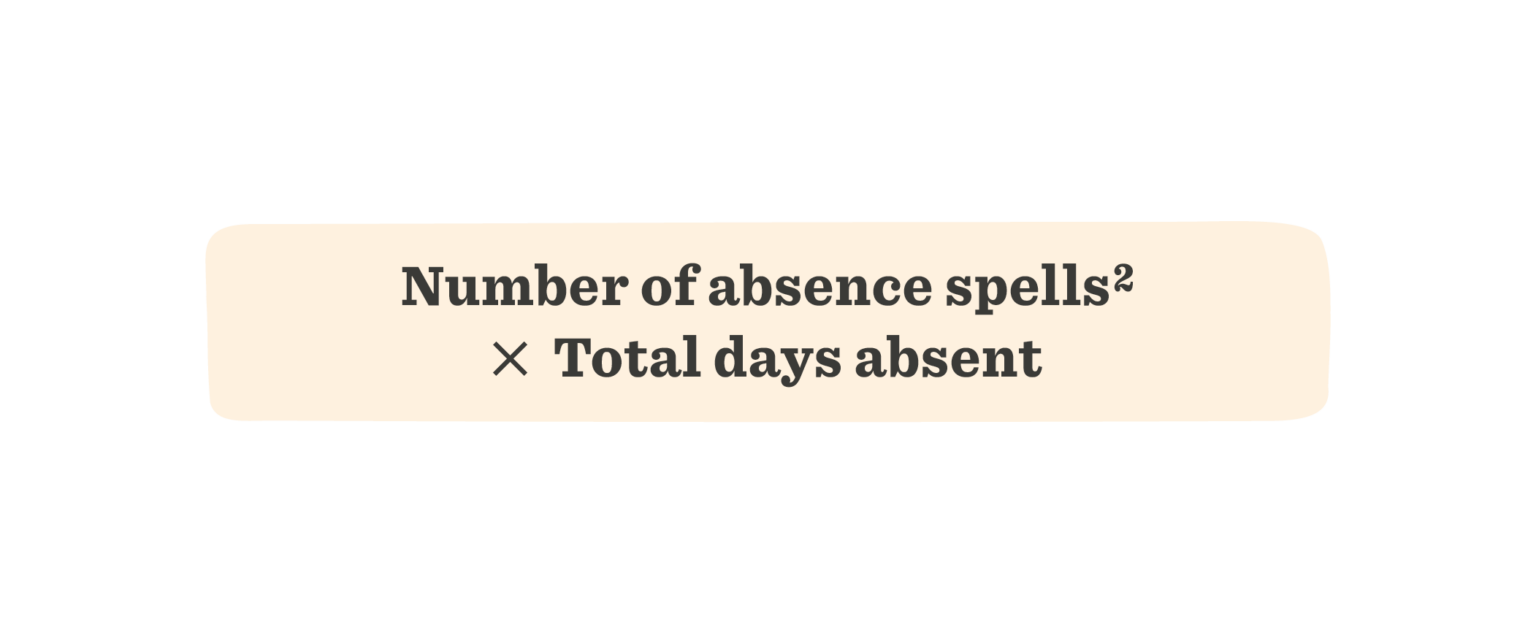
It provides one view of absence frequency, but not the circumstances behind it.
7. Presenteeism
Presenteeism refers to reduced productivity when people continue working despite being unable to perform at their usual capacity.
There’s no universal formula, but surveys, wellbeing data, absence patterns, and performance indicators can help identify broader trends.
Presenteeism may reflect health, workload, burnout, job design, psychological safety, or organizational culture. Harvard Business Review’s 2025 analysis put the cost of presenteeism to US businesses at up to $150 billion a year. That’s nearly ten times the cost of absenteeism.
8. Learning and development
L&D metrics become more useful when they show whether people are building capabilities the organization needs rather than just whether people completed courses.
- Course completion only tells you whether training happened
- Skills assessments, application, mobility, performance, and retention help show whether learning is translating into workforce readiness
DEI&B metrics
1. Pay gap
Pay gap measures the difference in average or median compensation between two groups.
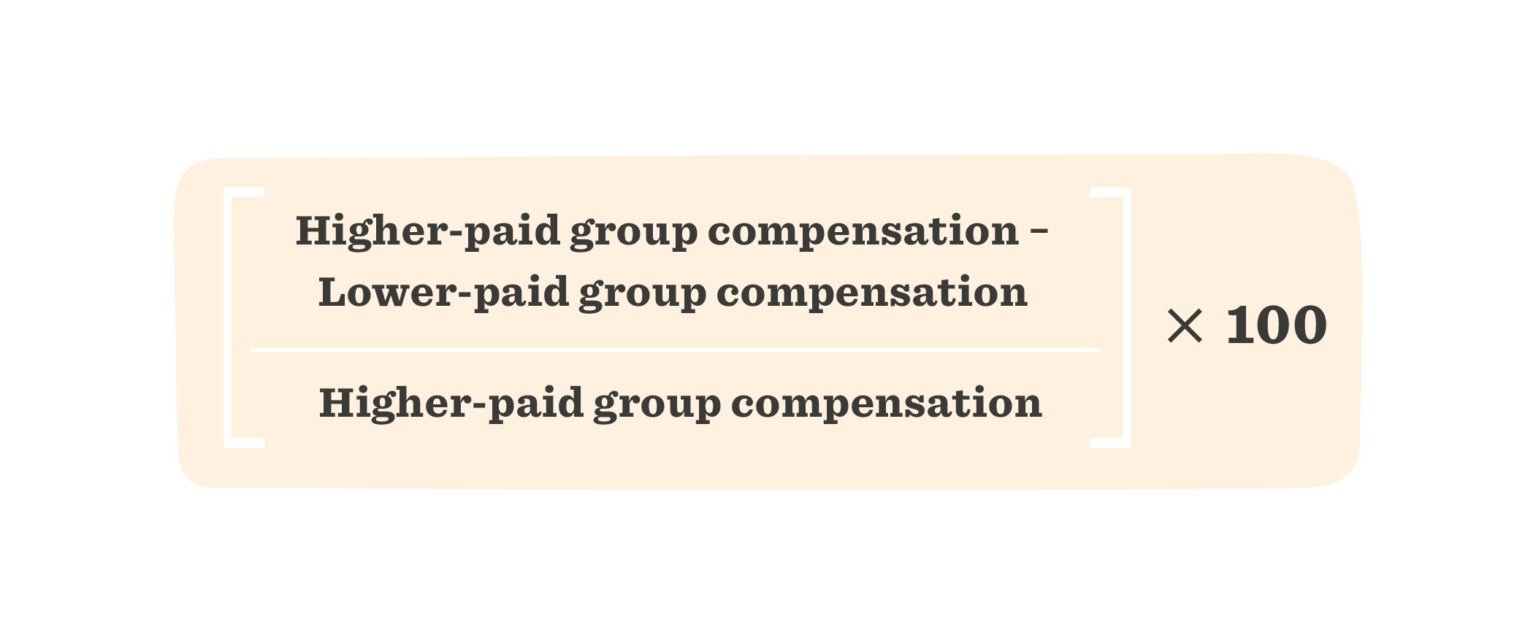
Pew Research Center found that women in the United States earned 85 percent of men’s median hourly earnings in 2024. Separately, BLS data for Q2 2026 found that women working full time had median weekly earnings equal to 82 percent of men’s.
Different methodologies produce different figures, so use a consistent approach when tracking your own organization.
2. Salary range penetration
Salary range penetration shows where someone’s salary sits within the established range for their role.
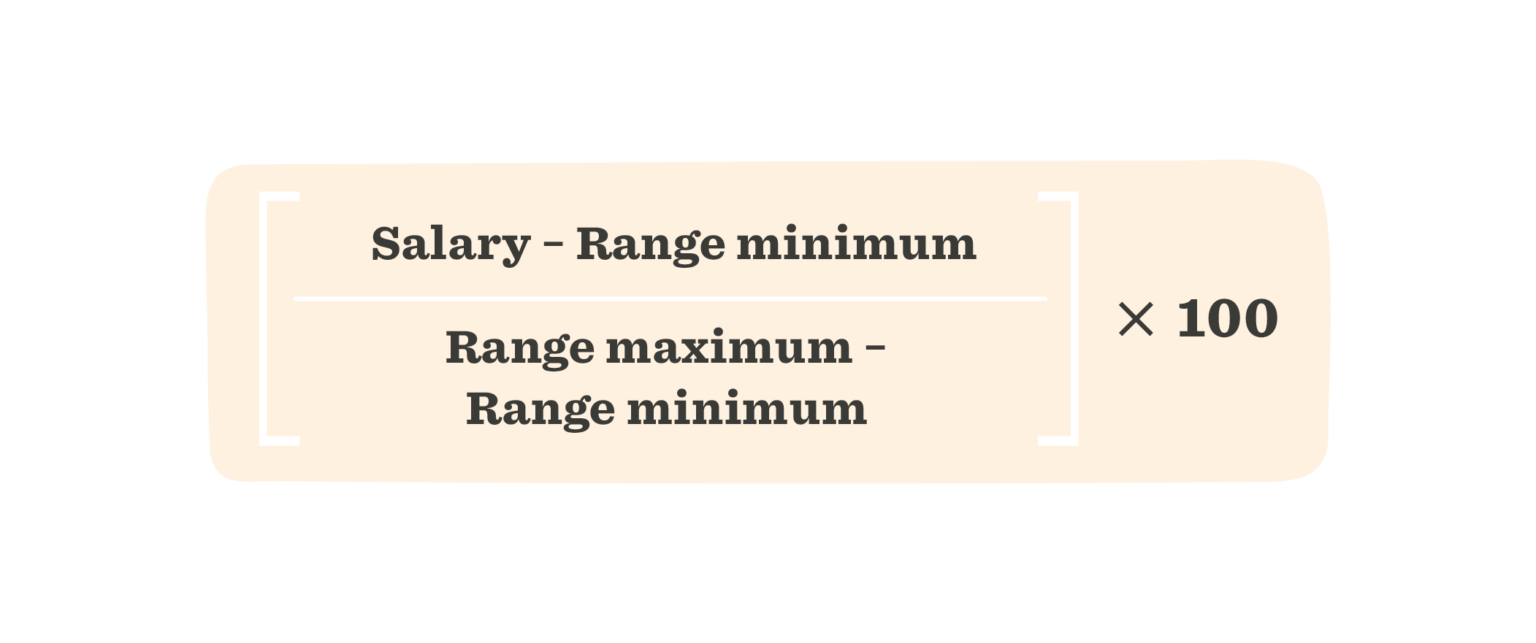
Comparing equivalent roles can support pay transparency and compensation strategies.
3. Salary average
Salary average measures the mean compensation across a selected group.
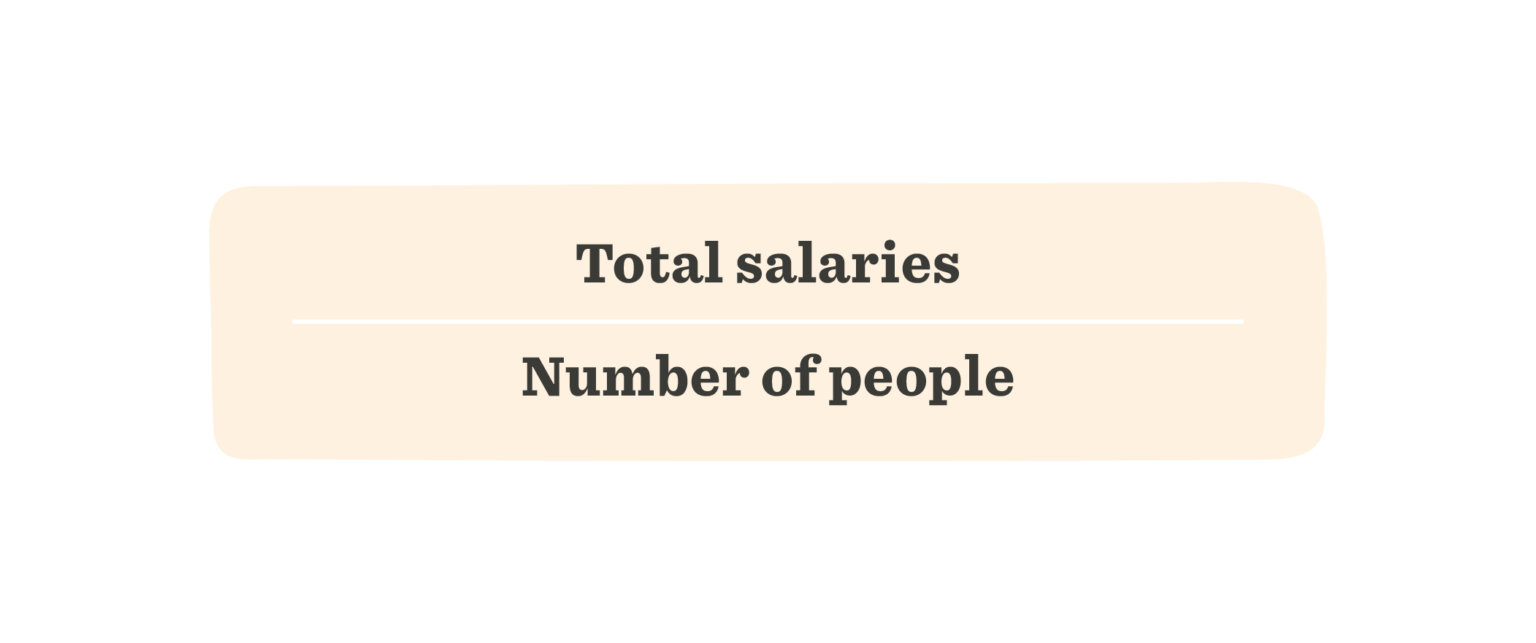
Medians or distribution analysis may provide additional insight where unusually high or low salaries distort the average.
4. Gender diversity ratio
Gender diversity ratio measures the representation of different gender groups within your organization.
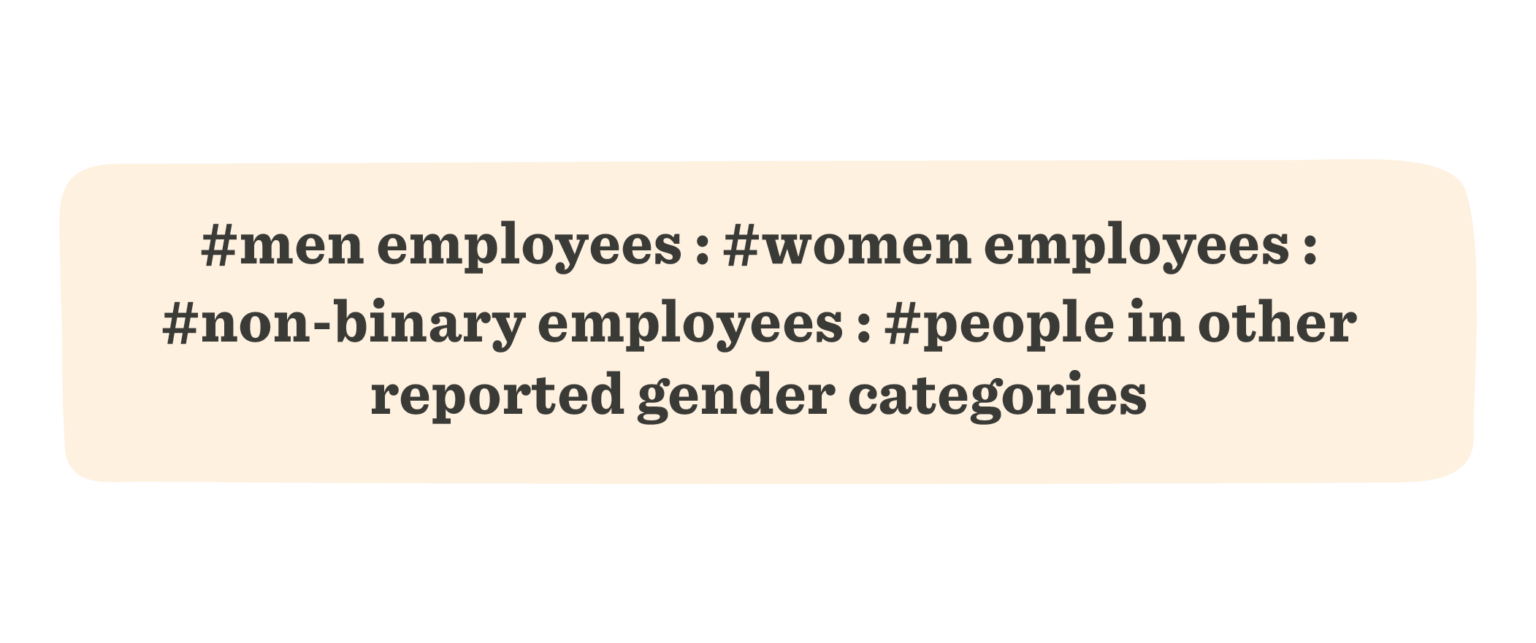
Note: Reduce the figures to the smallest whole-number ratio.
You can use the same approach to compare representation across teams, levels, or other relevant groups.
5. ERG participation rate
ERG participation rate measures engagement with Employee Resource Group activities or programs.
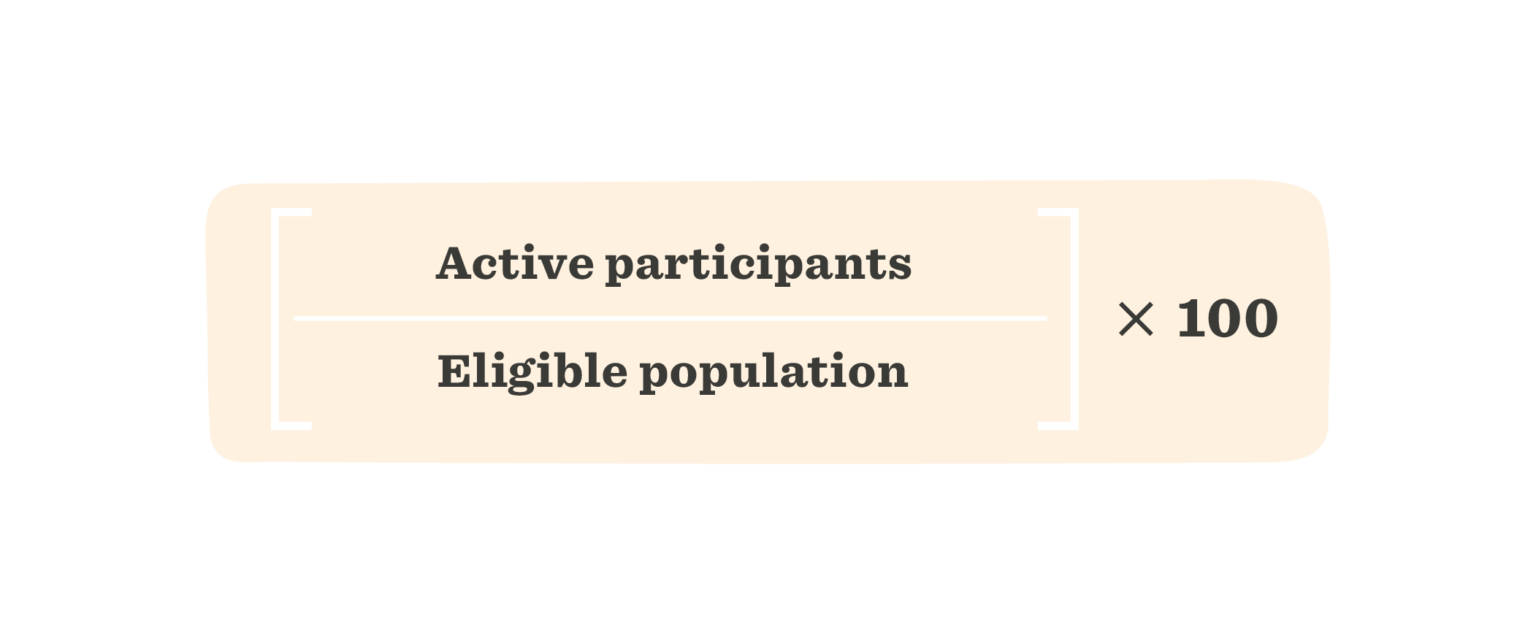
Participation shows whether people are engaging with a program. It cannot demonstrate inclusion, belonging, or program success on its own.
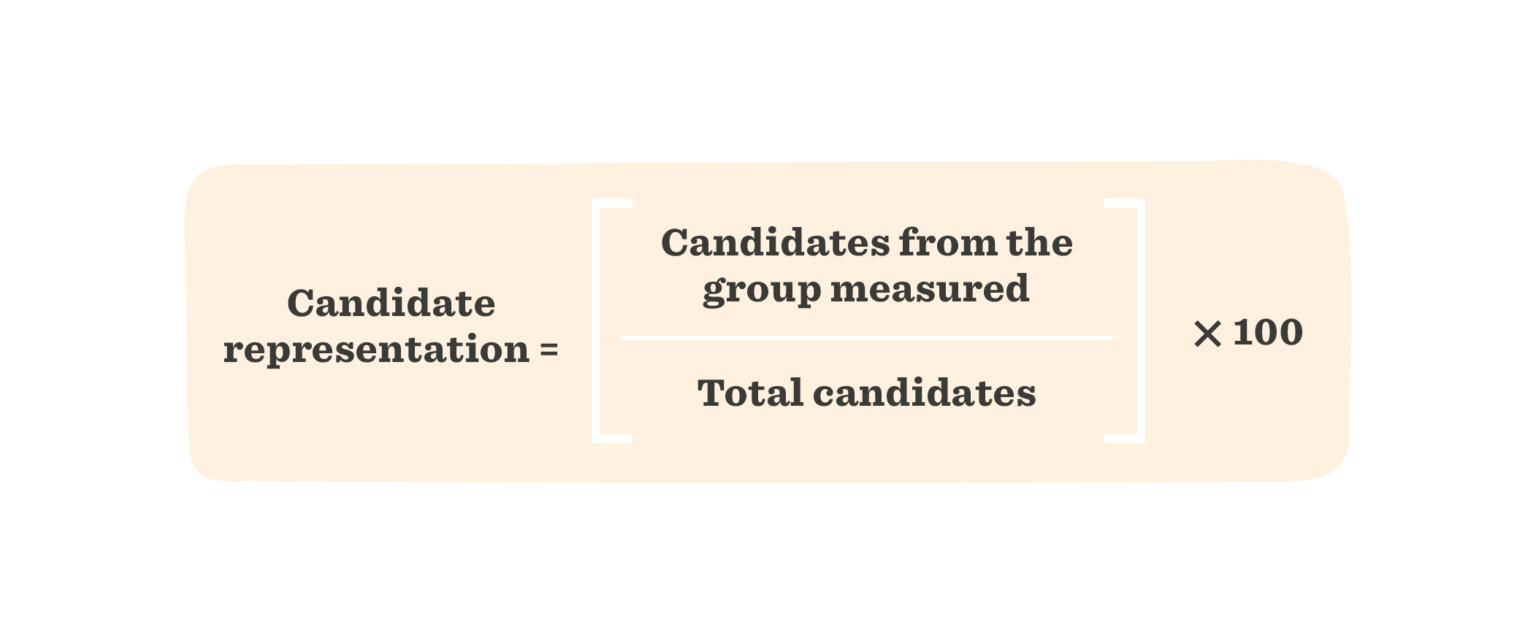
6. DEI&B initiative metrics
The right metric depends on the initiative. For example:
Pairing representation with hiring, promotion, pay, retention, engagement, and qualitative feedback can provide a fuller picture.
Business and workforce performance metrics
1. Revenue per employee
Revenue per employee measures revenue generated relative to workforce size.
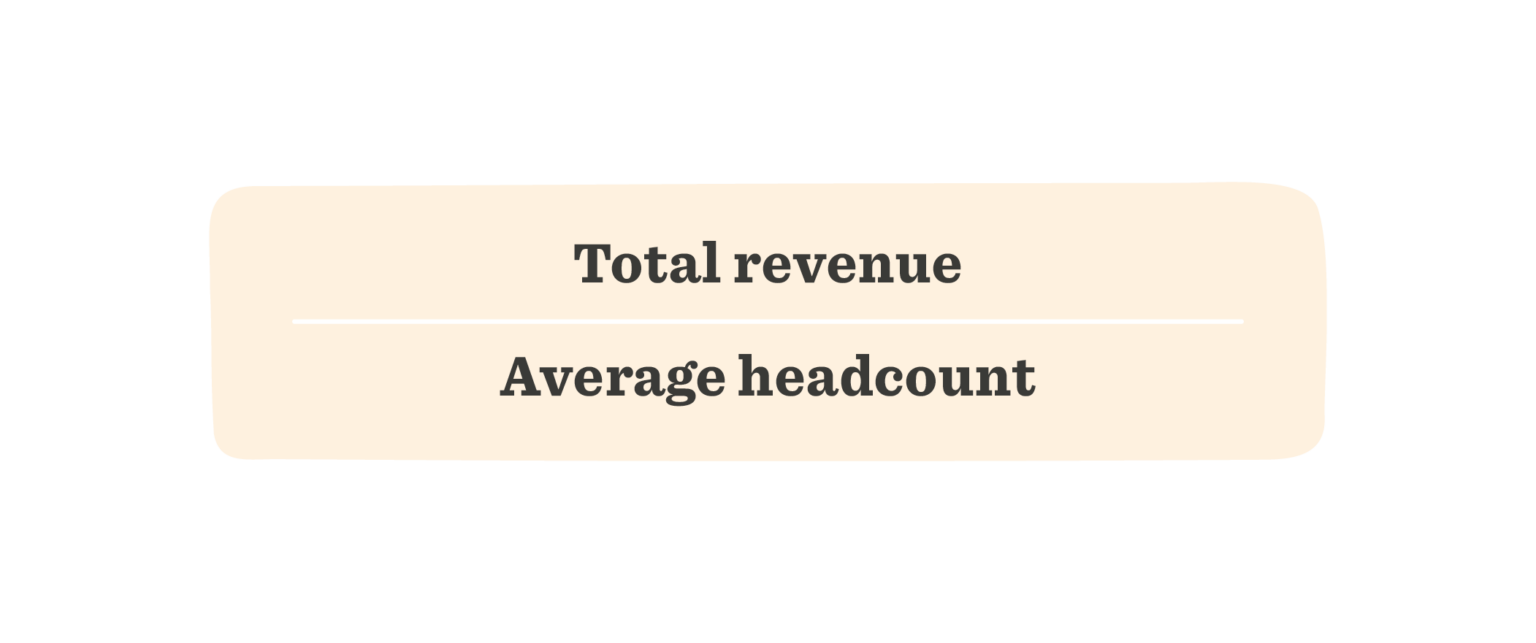
It can support productivity and workforce planning conversations, but varies significantly by industry, business model, automation, and workforce structure.
2. Labor cost as a percentage of revenue
Labor cost as a percentage of revenue shows how much revenue is allocated to workforce costs.
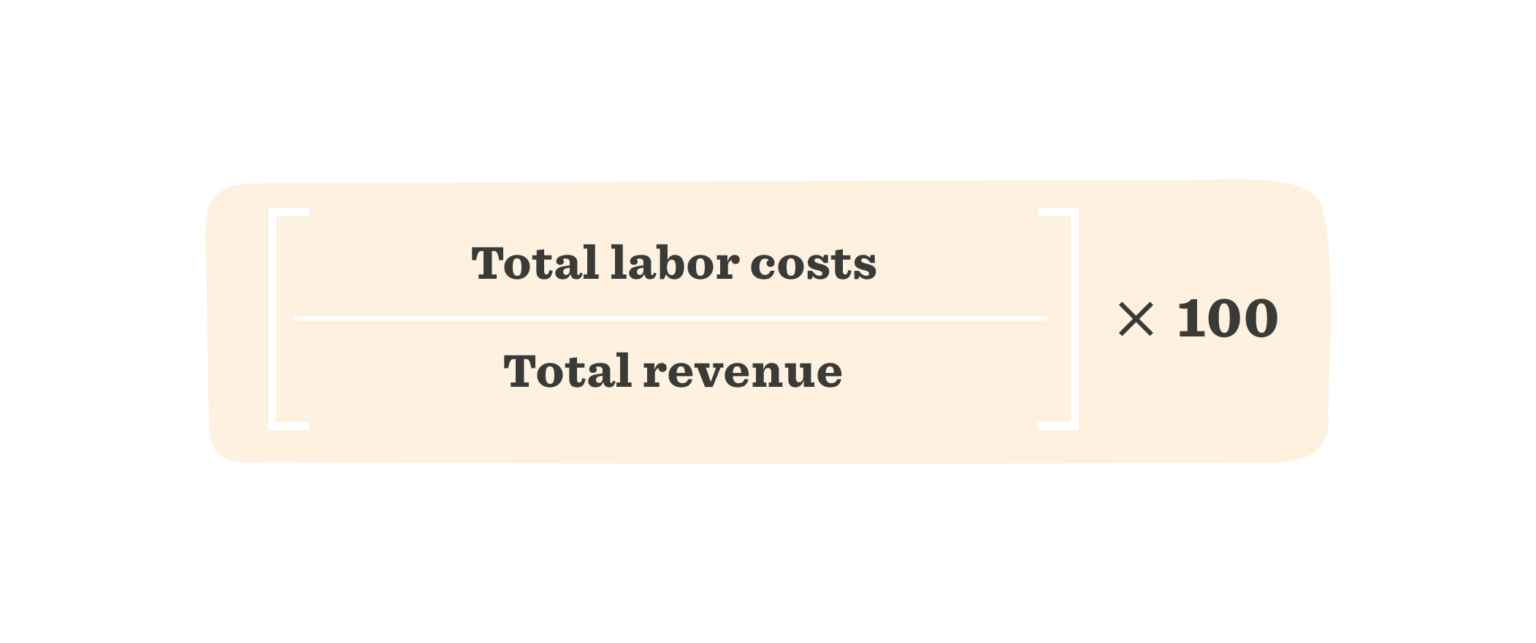
Tracking the trend can help HR and Finance understand workforce investment in relation to growth and performance.
3. Productivity and output
Productivity measures output relative to the workforce resources used to produce it.
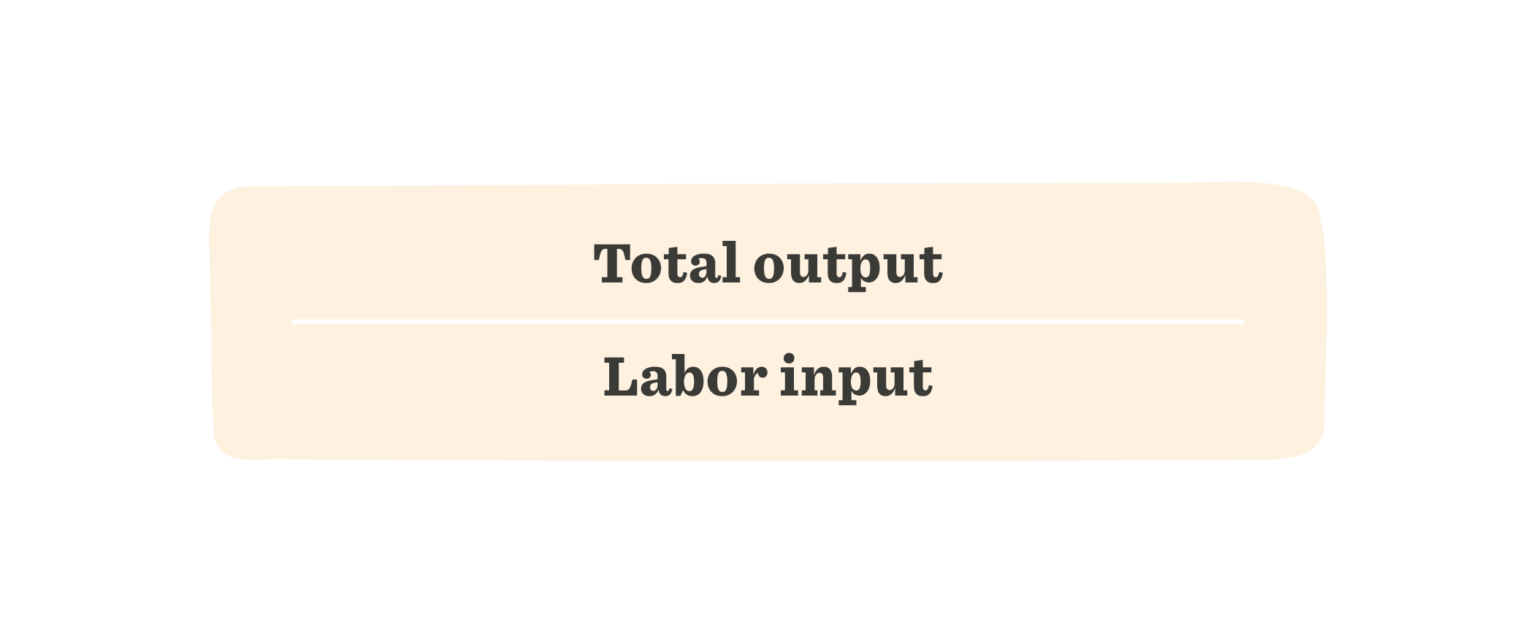
The right definition of output depends on the organization, from revenue and production to projects or customer outcomes.
4. Human capital ROI
Human capital ROI estimates financial return relative to investment in compensation and benefits.
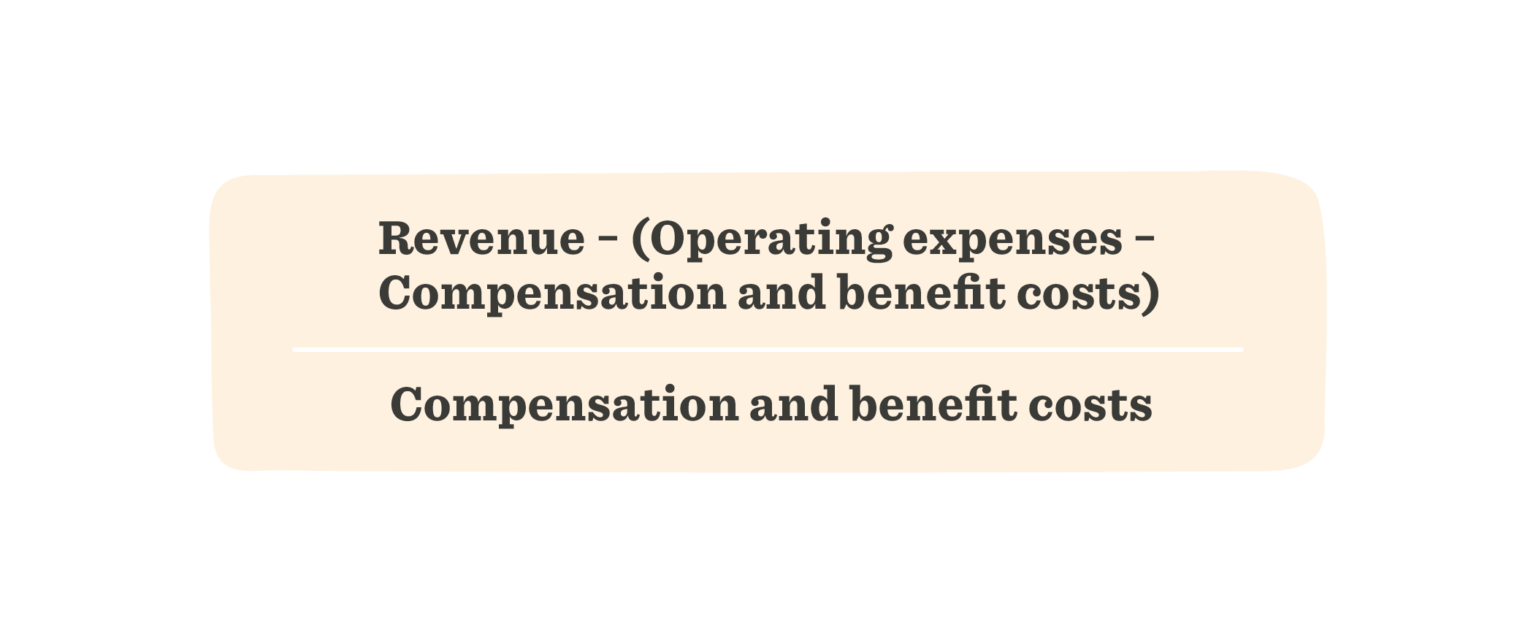
It can support HR and Finance conversations, but business model, accounting practices, and workforce structure all influence the result.
Use HR metrics to make better decisions
The strongest analysis starts with a question rather than a dashboard.
- Start with the decision. Define the workforce or business question you’re trying to answer.
- Choose the signal. Identify the metric—or combination of metrics—that can help you investigate it.
- Add context. Look at the relevant team, role, location, tenure, demographic, or business unit. An HCM can bring recruitment, engagement, retention, compensation, performance, and other workforce data together, giving HR a more connected view of what’s happening.
- Look for relationships. Imagine overall attrition is stable, but departures among experienced people in one critical team begin to rise. Looking at mobility, engagement, compensation, manager changes, and workload alongside that figure can reveal a very different picture of the workforce.
- Act and follow the result. HR can use that context to decide what to do next, track the relevant signals, and see whether the intervention changes the outcome.
Connected people analytics, supported by AI, can surface patterns across larger volumes of workforce information. HR then brings the context, judgment, and accountability to interpret them and decide how to act.

Recommended For Further Reading
- 9 workforce management metrics that drive success
- The payroll metrics that matter most
- 21 employee performance metrics to track
- Driving diversity: How to evaluate key DEI&B metrics
- Hire effectively: essential recruiting metrics to track
- 31 workforce planning metrics to track
- 10 trackable succession planning metrics for any organization
- How to integrate HR data for better decision-making
- 21 Leading HR reporting software
- HR effectiveness: What it is and how to measure it
Make HR metrics more meaningful
HR leaders don’t need to measure everything.
The most valuable metrics are the ones that help them understand what’s changing across the workforce and what deserves attention.
When trusted people data is connected with business context, HR can spot meaningful patterns earlier, bring clearer workforce insight into conversations across the organization, and make better-informed decisions for people and the business.
FAQs about HR metrics
The most useful HR metrics depend on your organization’s goals. Common examples include time-to-hire, quality-of-hire, employee engagement, attrition, internal mobility, compensation, productivity, and revenue per employee.
An HR metric measures an aspect of the workforce or an HR process. An HR KPI is a metric specifically chosen to track progress against a strategic objective.
HR metrics can help leaders identify changes across hiring, retention, engagement, skills, compensation, and performance. The value comes from connecting those signals with the right context so leaders can understand what may be driving the change and decide what to investigate or do next.
Ambient organizational intelligence is the ongoing visibility organizations can build from trusted, connected workforce and business data. It helps relevant patterns surface as they emerge while keeping context, governance, and human accountability central to decision-making.
Start with the workforce or business decision you need to make, then choose the metric—or combination of metrics—that can help you investigate it. Add context such as team, role, location, tenure, or business unit, and compare the signal with related workforce data before deciding what action to take.
AI can help analyze larger volumes of workforce data and surface patterns more quickly. Useful analysis still depends on trusted information, appropriate permissions, business context, and human judgment to interpret what those patterns mean and decide what to do next.