
It seems that everyone is talking about ‘people-centric cultures’ these days.
In a competitive recruiting environment, professionals have more choice than ever. Job openings continue to grow in the U.S., and people can pick companies based on more than just their salary offers.
As a result, businesses are racing to modernize their cultures, adopting healthier approaches to flexible work and hybrid work, and supporting the growth, development and happiness of their people.
HR leaders understand that doing so not only improves employee welfare, productivity, and retention rates but also creates brand ambassadors who support future recruitment. After all, the quality of your team is the ultimate contributor to a successful business.
But while HR leaders are making real efforts to create better, more productive environments, how can they be sure that their words and actions are being matched by results?
That’s where human resource reports come in. They’re a quick and effective way of quantifying your efforts, and making sure there aren’t gaps in your recruitment or retention strategies.
We’re going to break down the main human resource report samples that you need to improve your operation, and lay the foundations for a happier, healthier, more effective workplace.

What are HR reports?
An HR report is a way of capturing key data, facts, and insights about elements of your business, in order to track and analyze the work you’re doing.
Typically, they can help you find ways of improving your team’s performance, refining your recruitment practices, or making targeted strategic plans for the future. An effective HR report can help you to identify trends within your organization, pick out any inefficiencies, and inform better decisions.
Most businesses these days take advantage of advanced HR tech to generate their reports for them, saving hours of effort scraping and compiling the data manually. HRIS reports can also generate live dashboards that make it easy to see the most important data in just a single glance, helping HR leaders skip straight to the insights that matter.
Whichever way you go about it, our examples of HR reports will give you a good grounding in the main areas to consider.
Why do you need HR reporting?
With businesses needing to be agile and flexible in their recruitment, regular reporting is a surefire way of keeping your finger on the pulse, and understanding exactly what is happening at your company.
An HR platform will filter and sort the results for you, turning it into meaningful data that you can use. When it comes to areas like risk avoidance, succession planning, and resilience testing, up-to-date and accurate information is essential.
HR reporting will reinforce your business in three main ways:
- Identifying issues and areas for improvement
Effective and comprehensive reporting can help HR leaders look below the surface and pick out trends that affect their teams. If, for example, only a small proportion of your development team understand a key programming language, you’re likely to want to organize appropriate training or reconfigure your succession planning.
Similarly, an above-average turnover rate will reveal issues within the work environment or team dynamics that will warrant further and more thorough investigation. These kinds of insights are much harder to detect without the data to draw them out.
- Supporting strategic, targeted planning
Whatever field you work in, effective decision-making is always powered by information. Gathering the right insights via your reporting will allow you to make informed choices about the future direction of your HR function and the business as a whole.
- Predicting risks and boosting communication
The data you glean in your reports can help you forecast what’s around the corner, revealing both risks and opportunities that lie ahead. Compare these with your short and long-term goals, and you’re more likely to make the right choices when it comes to the major calls. Clear, well-packaged reports also ease communication with the rest of senior management, helping you support your case in internal discussions and giving everyone the benefit of cold hard data.
- Tracking the performance of your people, and supporting their growth
When people are struggling, it’s all too easy for them to keep quiet, whether out of pride, embarrassment, or a simple lack of time and energy. HR reporting makes it easier to identify team members who might benefit from additional support, or whose skills aren’t being utilized to their full potential. This isn’t about breathing down people’s necks, it’s about making sure you’re providing the opportunities for feedback and guidance that any professional needs—after all, happier people perform better and stick around for longer.
Best practices for HR reporting
To be sure that your HR reporting is hitting all the right notes, there are a few main practices that are worth following:
- Choose the right focus
For your findings to be usable, you need to frame them correctly. That means choosing the right frequency for your report, whether that’s weekly, monthly, quarterly, or even annually. It’s also crucial to consider what form you’d like your output to be in. What do you need from the data, and how will you use the report? Answering this question will help keep you focused when building your reporting structure so that it’s as useful as possible.
- Use a mix of KPIs
Once your aims are clear, you can build your report structure out with a range of KPIs to measure. Make sure you include a mixture here so that you can easily identify any inconsistencies and make up for gaps that might appear in the data. Choosing the metrics that matter goes a long way to making your report as effective as it can be.
- Automate as much as you can
Tools such as people analytics software make it much easier to build and generate reports. By automating the data collection process, you’ll save your team hours in manual processing time, which can instead be used to analyze the results and build strategies to improve your work. Automation will also gather all your results and reports together in one place, through live dashboards that make it easy to see what’s important.
- Take it forwards
Carrying out your HR reporting is only a means to an end, so it’s important that you build structures and processes for taking your findings and adjusting or creating future strategies. Think about how you’ll store historical data for comparison, or to benchmark your performance before and after you make a significant change. Analyze your results, draw your conclusions, and take the actions you need to improve your business’s performance.
Types of HR reports
Human resources operate across the full spectrum of business activities. Unsurprisingly, therefore, HR reports come in many shapes and sizes, depending on which area of your business you wish to analyze.
These may focus internally on training, talent management, or identifying skills gaps, or externally on performance and recruitment practices. The insights you generate will help you make smarter business decisions when it comes to managing your current teams, and when you look at the future of your company.
We’ll be taking a deep dive into recruitment, retention, and diversity, equity, and inclusion reporting with templates and samples, but there are many other reports you can carry out. Here are just a few:
People performance report
Typical frequency: Annual, or via a live dashboard
Purpose: This type of report gives you a clear overview of how effective your teams are, and whether you’re hitting your productivity targets. It can help you to identify skills gaps and training needs, and support effective succession planning.
Main KPIs: Absenteeism rate; overtime hours; training costs; employee productivity
Example findings: You might discover uneven workloads between individuals or teams, and areas where you’re over- or under-spending on training and development programs. Catching skills gaps or people who need more support with their work will help you keep performance levels high.
Talent management report
Typical frequency: Monthly
Purpose: A talent management report or dashboard gives HR leaders a clear overview of the expertise and talent that lies within the company. It will include basic information and figures that help you keep track of your people, but will also reveal insights such as cost per hire, time-to-fill, and satisfaction scores.
Main KPIs: Turnover rate; cost per hire; time-to-fill; satisfaction scores (or employee net promoter score (eNPS)); performance ratings; total staff number; total monthly salary outgoings; vacancies; average length of service; average training costs
Example findings: Your basic dashboard gives you a comprehensive overview of how your people are performing, and whether you’re within budget on recruitment, training, and culture-boosting activities. Segmenting by departments can highlight teams with particular retention issues or a specific factor that is affecting satisfaction or performance levels.
Overtime monitoring
Typical frequency: Weekly
Purpose: Tracking overtime hours on a regular basis gives you a clear idea of your people’s workloads, and whether there is temporarily a higher volume of work that needs completing. If this becomes a regular occurrence, you’ll need to take action to avoid an uptick in absenteeism and reduced satisfaction amongst your people.
Main KPIs: Overtime hours—for example, segmented by department, job role, age group or working location
Example findings: Overwork can quickly lead to burnout, which in turn increases your turnover rate—costing your business money due to expensive recruitment and training costs. Keeping a close eye on overtime gives you useful advance warning of any likely issues here.
Salary and compensation report
Typical frequency: Quarterly
Purpose: Salaries and remuneration are no longer just the domain of Finance. In fact, CFOs and HR should rely closely on each other for effective talent management. That means HR leaders need to monitor all the compensation you offer, such as insurance, pension plans, and bonuses—as well as salary levels themselves.
Main KPIs: Total salary costs; benefit payments; overtime payments; incentive payments; salary comparison between departments; pay brackets and length of service
Example findings: Your analysis will inform smarter decisions when it comes to salary negotiations, paid leave, resource allocation, and your policies around incentives, bonuses and benefits.
HR report examples
Let’s take a closer look at three HR report examples, relating to retention, recruitment, and diversity, equity, and inclusion.
Retention report example
Objective: Keeping hold of your best employees is one of the biggest concerns for HR leaders—this report gathers everything you need to build loyalty and trust, and ultimately reduce your recruitment costs.
KPI 1: eNPS (employee net promoter score)
eNPS is based on a survey that asks your people how likely they are to recommend your company as a place to work, out of ten. Their responses split your professionals into “detractors”, “passives” and “promoters”, and give you a clear overview of happiness levels across your organization. Surveys are typically run quarterly, can also be segmented to identify localized issues, and form an important part of the dialogue between managers and professionals.
KPI 2: Career path ratio
Career path ratio helps you track the direction in which people move within the company. By dividing the total number of promotions by the total number of role moves, you can see how ‘vertical’ your internal movements are. A high ratio of promotions might cause talent to become trapped and bored, whereas a complete lack of vertical career opportunities can encourage people to look elsewhere.
KPI 3: Salary change
Calculating your salary change with the formula below can help you make accurate projections of your future outgoings. A healthy figure will likely boost retention and increase loyalty, as people are incentivized to stay with you.
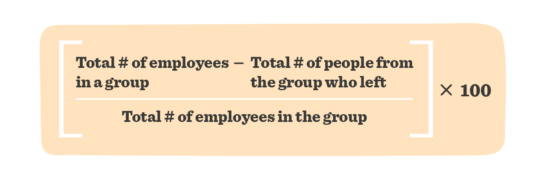
KPI 4: Absenteeism
In an ideal world, your absenteeism rate will be close to zero. Unexcused absences affect team morale and leave others to pick up the slack, so it’s important to make sure one-offs don’t become recurring patterns.
Recruitment report example
Objective: Hiring better talent, faster is crucial, whether you’re following an agile or growth strategy. With professionals having now become well accustomed to modern recruitment experiences, it’s important to make sure you’re set up to attract the best of the best.
KPI 1: Time-to-fill and time-to-hire
These are two of the most meaningful recruitment metrics around, and give a quick insight into the effectiveness of your recruitment. They can be measured company-wide or role-by-role, and give you a good benchmark to assess your performance.
KPI 2: Quality of hire
Analyzing the quality of your hires is tricky, but, when done right, can help you repeat actions that attracted the best talent, and avoid techniques that didn’t. Depending on the nature of your business, specific metrics will vary, but typically focus on appraisal scores, retention rates, and feedback from peers and managers. If you can perform this analysis in real-time, you’ll immediately see the positive impact of improvements to your recruitment process.
KPI 3: Employee growth rate
Looking at changes in your staffing levels over time directly reflects your company size, and can give you a good idea of its success, when compared with your overarching business strategy.
Diversity, equity, and inclusion report example
Objective: Creating a culture of fairness and shared opportunities not only improves your potential talent pool, but diverse teams also work better together. This report helps you assess your performance, and identify areas of improvement.
KPI 1: Pay gap
While the gender pay gap remains significant and regularly makes headlines, pay gaps also exist when analyzed based on race and ethnicity. Capturing your own figures as a percentage gives HR leaders the information they need to structure effective, targeted strategies and to make the case for change.
KPI 2: Salary range penetration
This metric reports on how far into their respective salary range each team member is. It can help reveal pay gap issues and unearth inequities.
KPI 3: Salary average
Average salaries—across teams, demographics, or your entire organization—help you to understand how fair your pay structure is, and whether there are any specific issues you can address.
KPI 4: Gender diversity ratio
Calculating a simple ratio between genders gives you a snapshot of your representation, and helps you build an inclusive culture that gives everyone a fair chance at success.
Meet Bob
At HiBob, we’ve built a modern HR platform designed for modern business needs—today and beyond.
We focused on building something that is robust yet intuitive and easy-to-use, which has led Bob to be the platform of choice for thousands of fast-growing modern, mid-sized organizations.
For HR, it delivers automation of many common processes, allows greater oversight and visibility of the business, and centralizes all people data in a secure, user-friendly environment.
For managers, it provides access to data and insights to help them lead more effectively and streamline processes.
For employees, it’s the tools and information they need to connect, develop, and grow throughout their journey.
In a short time, Bob can be deployed to enable communication, collaboration, and connectivity that drives stronger engagement, productivity, and business outcomes.